
In this blog post, we show how to use Aim’s basic to highly advanced functionality in order to track your machine learning experiments with various levels of granularity and detail. We are going to run through basic tracking that every researcher/engineer would need throughout his development cycles, into a complete end-to-end experiment tracker that slices through the task across various dimensions.
Starting from basics: how Aim tracks machine learning experiments
Most of the people working within the machine learning landscape have in some capacity tried to optimize a certain type of metric/Loss w.r.t. the formulation of their task. Gone are the days when you need to simply look at the numbers within the logs or plot the losses post-training with matplotlib. Aim allows for simple tracking of such losses (as we will see throughout the post, the ease of integration and use is an inherent theme)
To track the losses, simply create an experiment run and add a tracking common like this
aim_run = aim.Run(experiment='some experiment name')
# Some Preprocessing
...
# Training Pipleine
for batch in batches:
...
loss = some_loss(...)
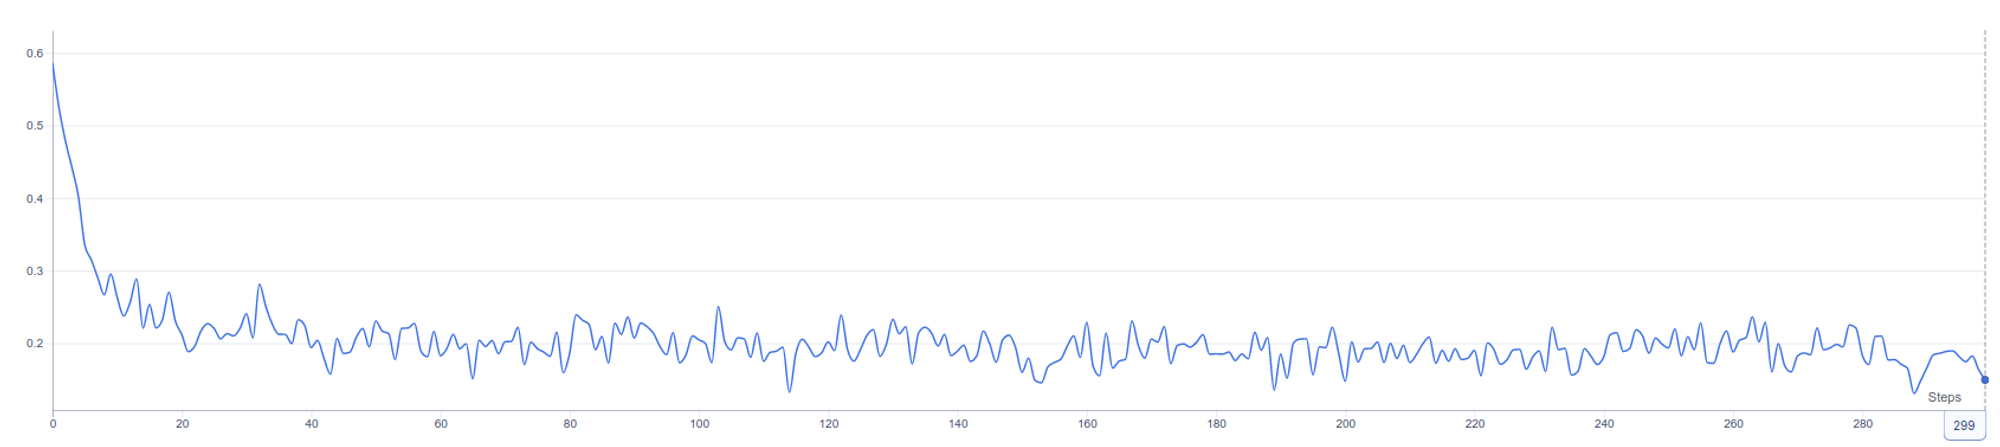
aim_run.track(loss , name='loss_name', context={'type':'loss_type'})You are going to end up with a visualization of this kind.
A natural question would be, what if we track numerous machine learning experiments with a variety of losses and metrics. Aim has you covered here with the ease of tracking and grouping.
aim_run = aim.Run(experiment='some experiment name')
# Some Preprocessing
...
# Training Pipleine
for batch in batches:
...
loss_1 = some_loss(...)
loss_2 = some_loss(...)
metric_1 = some_metric(...)
aim_run.track(loss_1 , name='loss_name', context={'type':'loss_type'})
aim_run.track(loss_2 , name='loss_name', context={'type':'loss_type'})
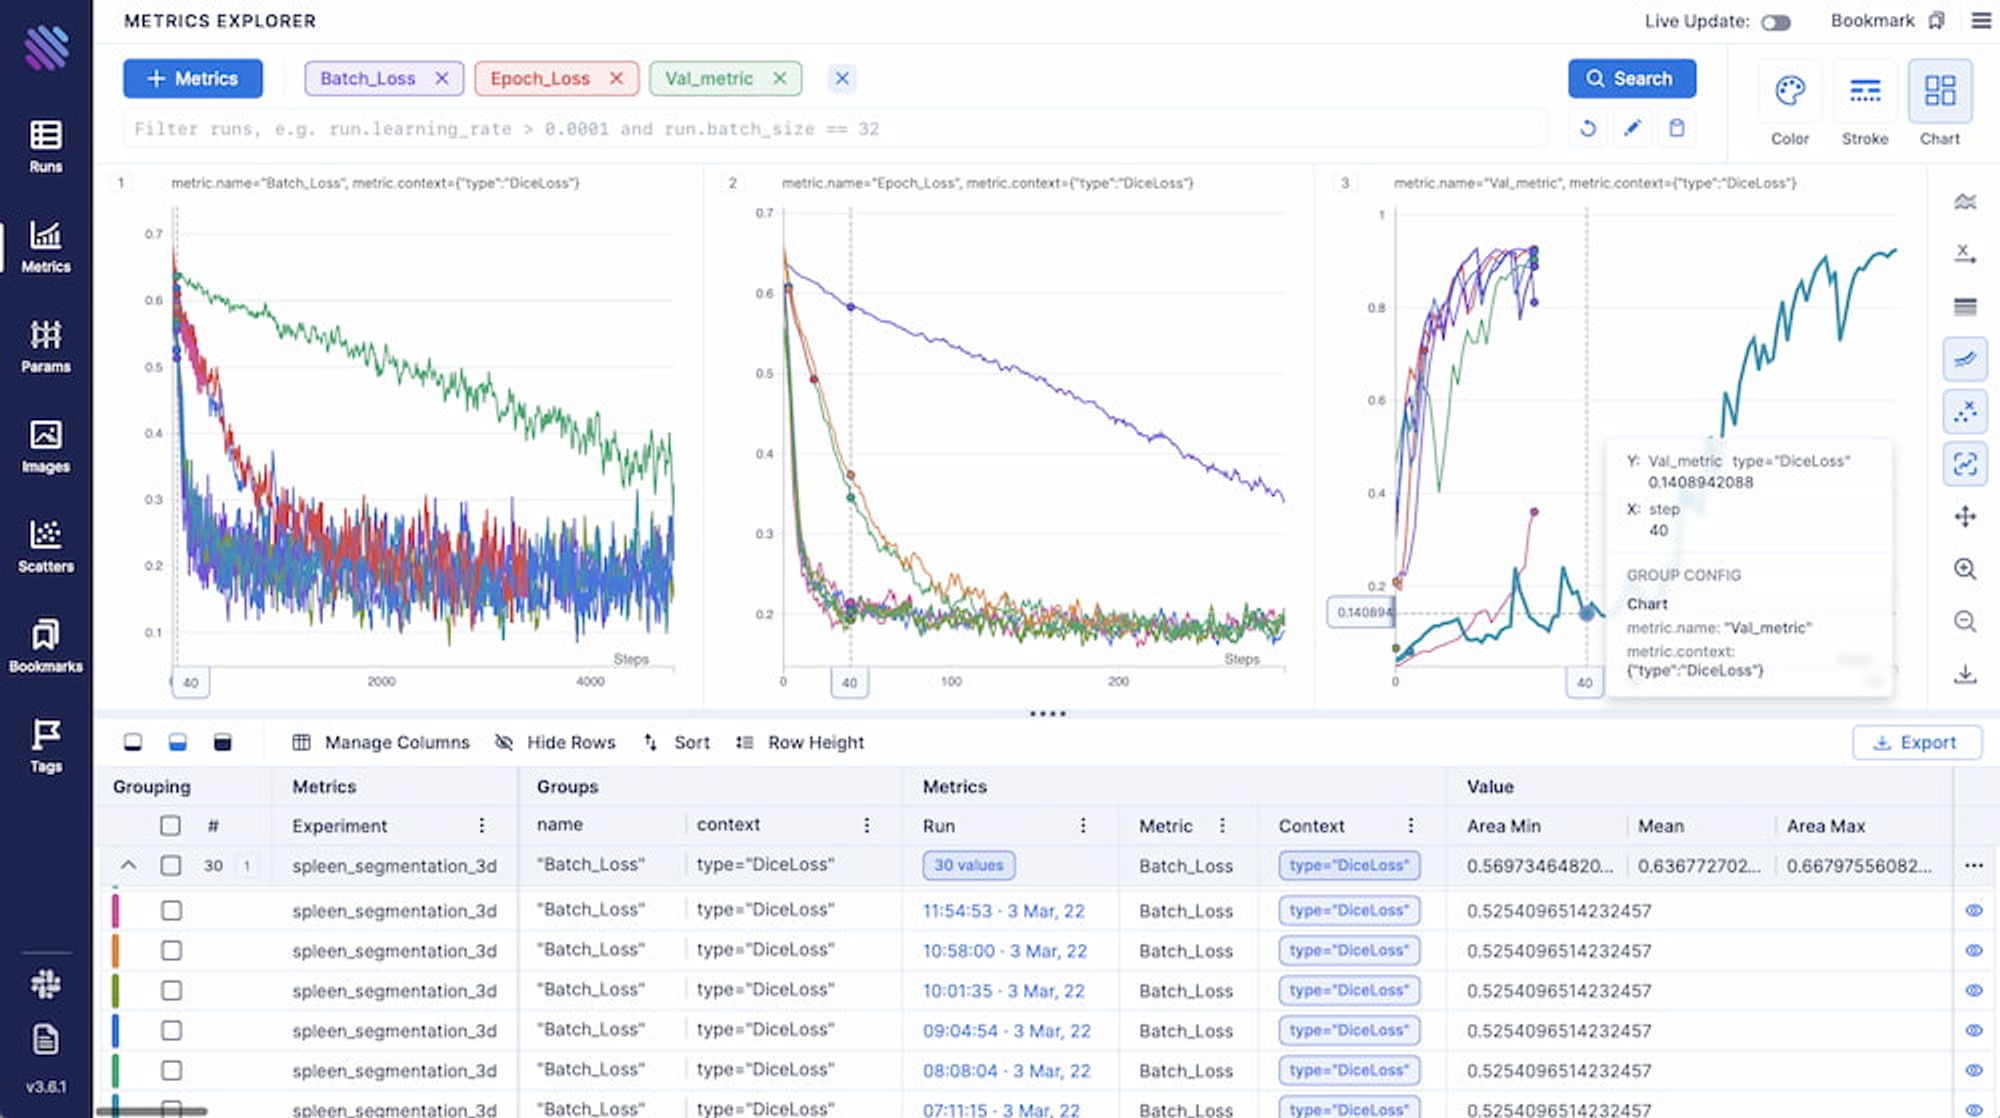
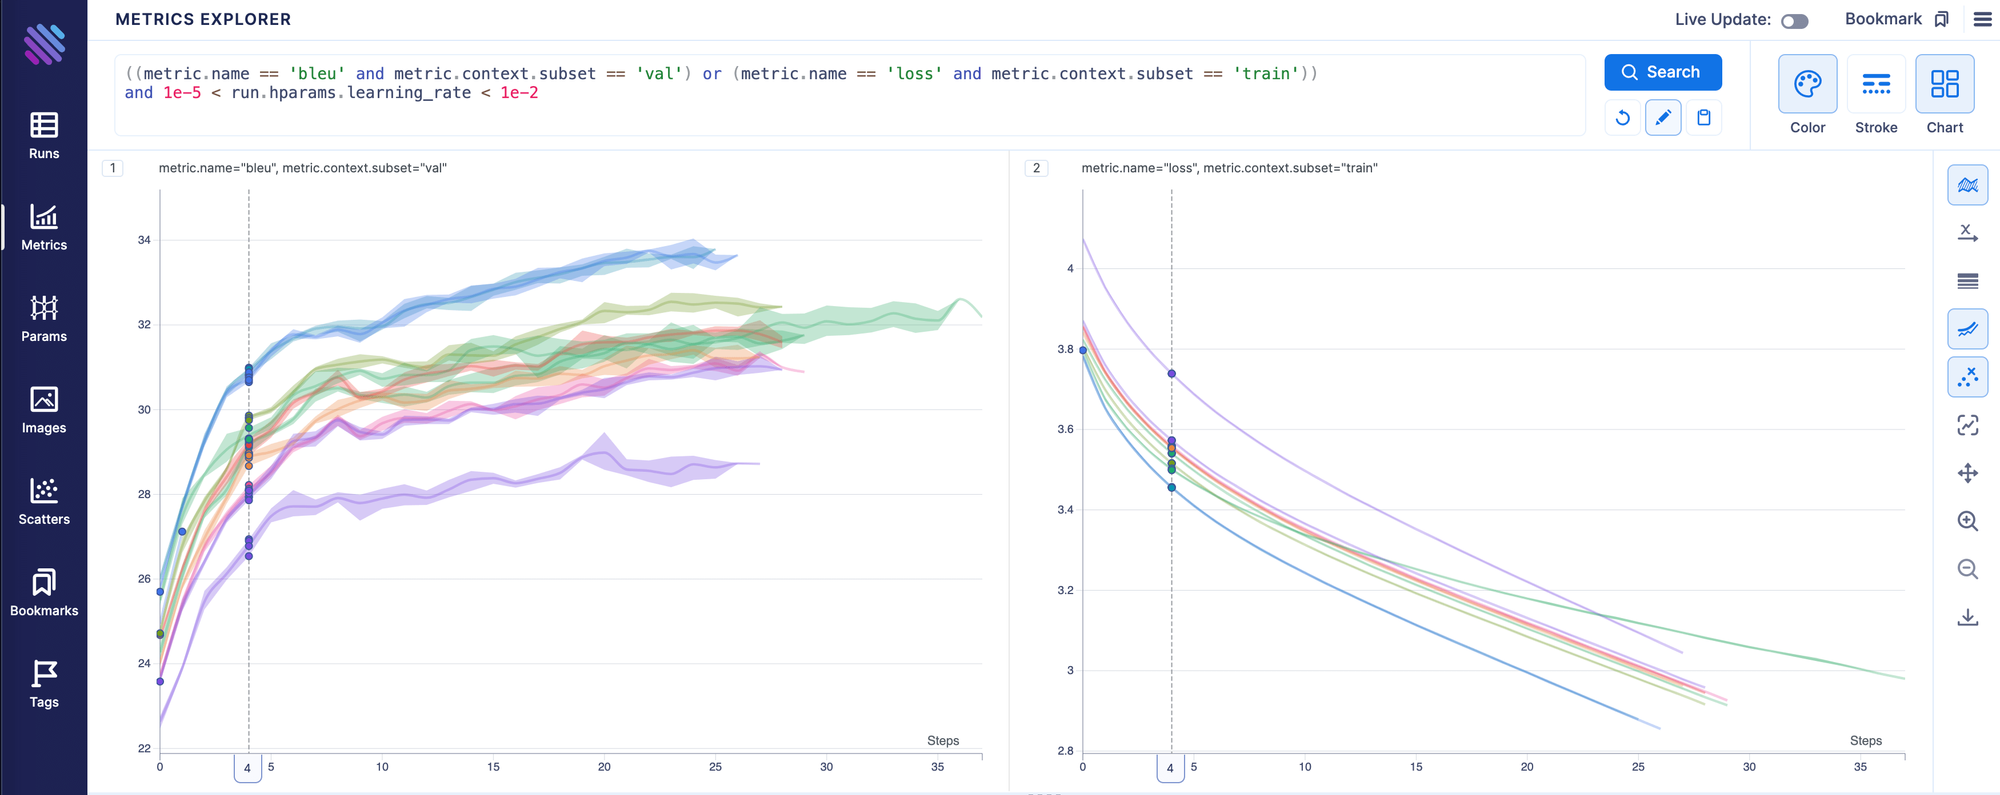
aim_run.track(metric_1 , name='metric_name', context={'type':'metric_type'})After grouping, we end up with a visualization akin to this.
Aggregating, grouping, decoupling and customizing the way you want to visualize your experimental metrics is rather intuitive. You can view the complete documentation or simply play around in our interactive Demo.
Rising beyond watching losses
At one point across the development/research cycle, we would like to be able to track model hyper-parameters and attributes regarding the architecture, experimental setting, pre/post-processing steps etc. This is particularly useful when we try to gain insights into When and Why our model succeeded or failed. You can easily add such information into an aim run using any pythonic dict or dictionary-like object, i.e.
aim_run = aim.Run(experiment='some experiment name')
aim_run['cli_args'] = args
...
aim_run['traing_config'] = train_conf
...
aim_run['optimizer_metadata'] = optimizer_metadata
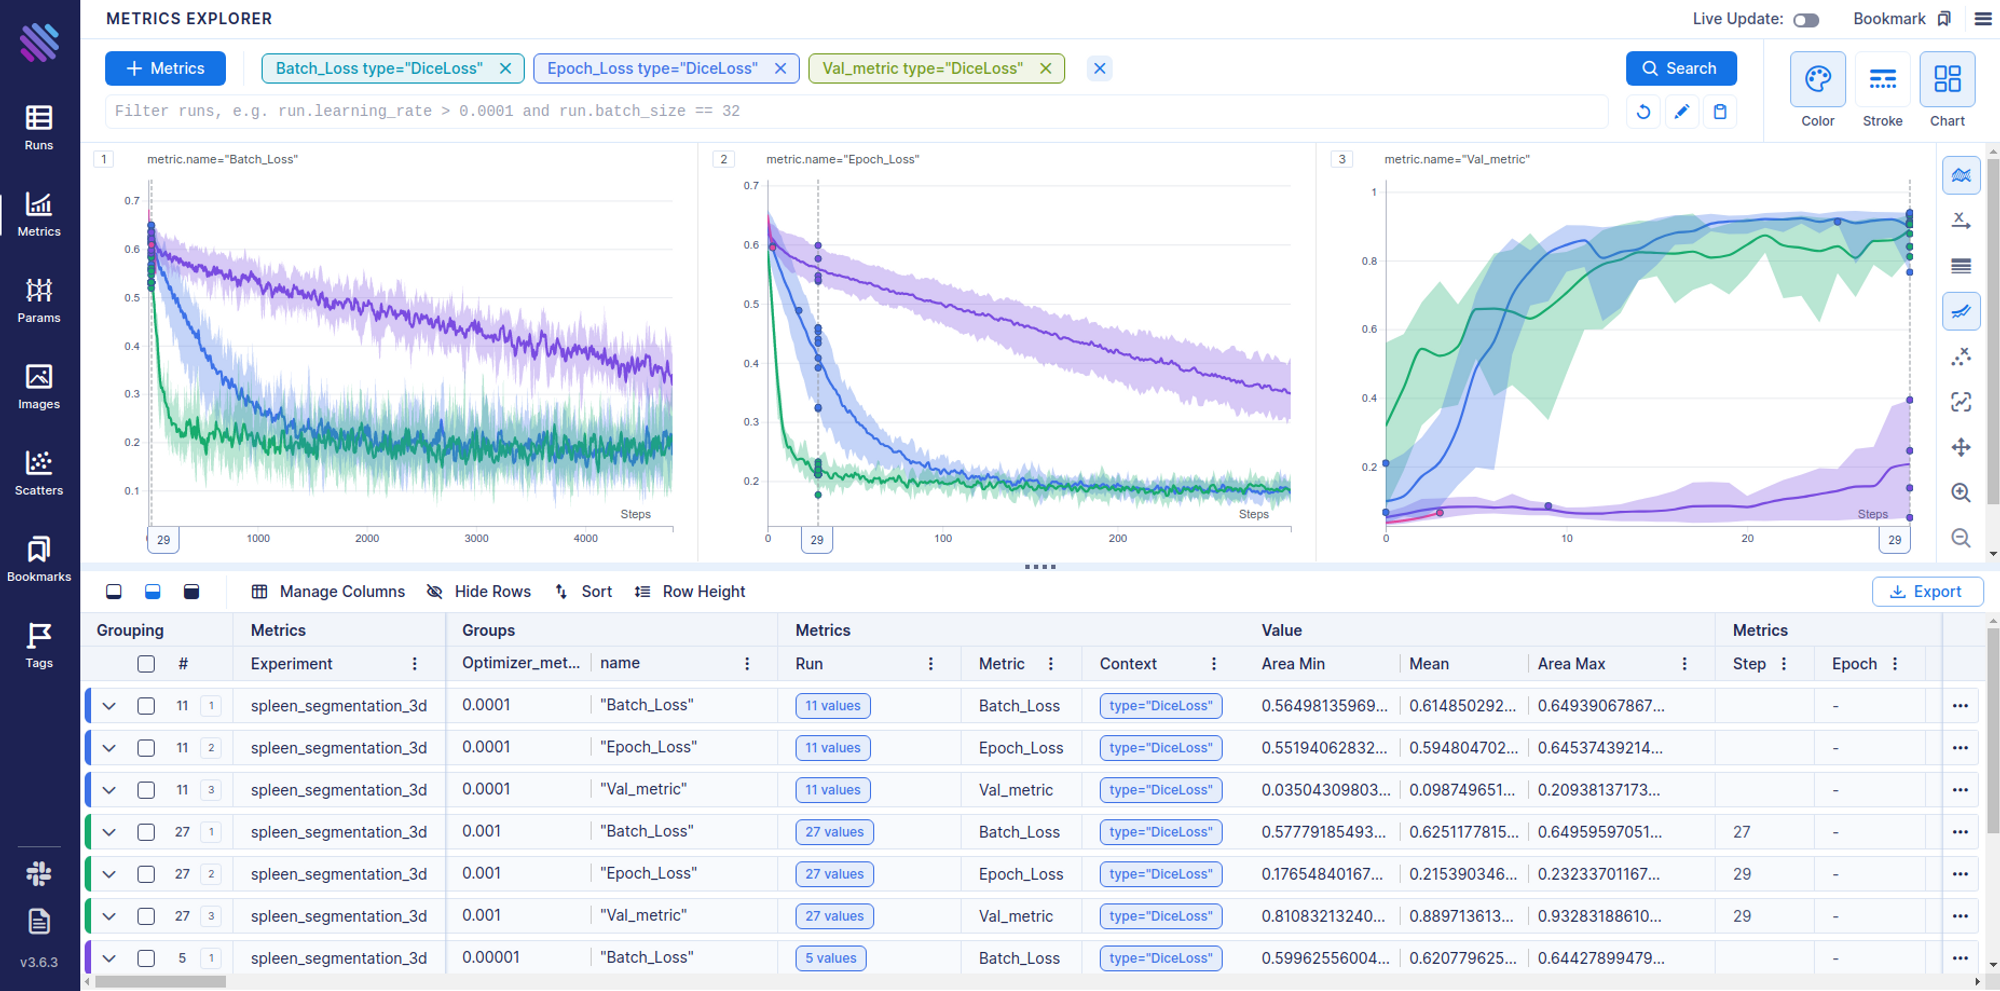
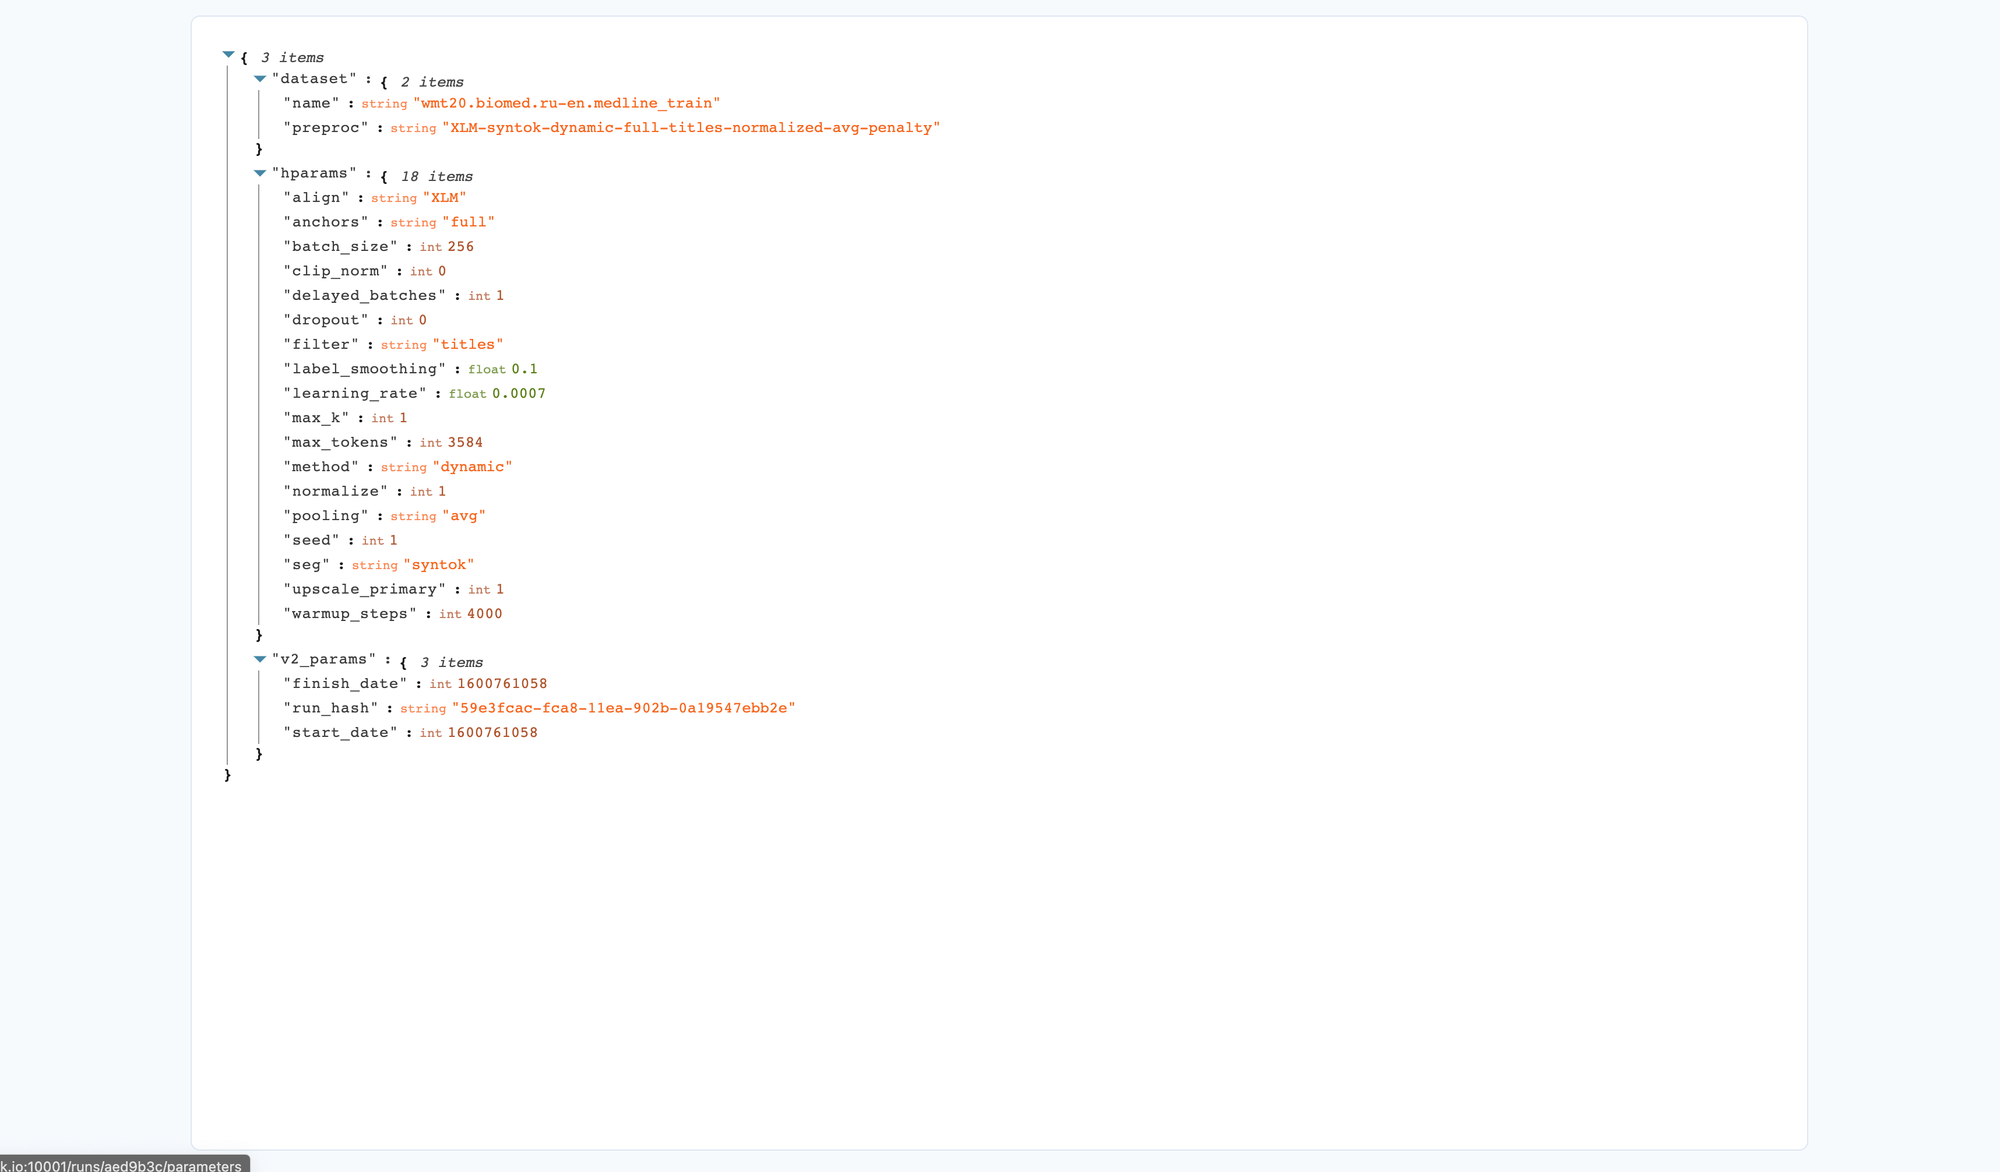
...In the previous section, we already mentioned that it is possible to use various customizable groupings and aggregations for your visualizations, furthermore, you can group with respect to the parameters/hyperparameters that you saved with aim.
Viewing the standalone parameters is fast for each separate Single Run
Filtering/grouping your runs using the selected trackable can be accessed and looked through in our interactive tutorial.
For a more in-depth/hands-on filtering of metadata you track in machine learning experiments, you can use our very own pythonic search query language AimQL, by simply typing a pythonic query on the search bar. Note that AimQL support auto-completion can access all the tracked parameters and hyperparameters.
What if numbers are simply not enough?
Various machine learning tasks can involve looking through intermediate results that the model produced in order to understand the generalization capacity, rate of convergence or prevent overfitting among many other uses. Such tasks involve but are not limited to semantic segmentation, object detection, speech synthesis etc.
Aim supports tracking objects such as images (PIL, numpy, tf.tensors, torch Tensors etc.), audios (Any kind of wav or wav-like), Figures and animations (matplotlib, Plotly, etc.). Tracking of these objects is completely reminiscent of the loss tracking:
aim_run = aim.Run(experiment='some experiment name')
...
aim_run.track(
aim.Image(image_blob, caption='Image Caption'),
name='validation',
context={'context_key': 'context_value'}
)
...
aim_run.track(
aim.Figure(figure),
name='some_name',
context={'context_key':'context_value'}
)
...
# You can also track a set of images/figures/audios
aim_run.track(
[
aim.Audio(audio_1, format='wav', caption='Audio 1 Caption'),
aim.Audio(audio_2, format='wav', caption = 'Audio 2 Caption')
],
name='some_name', context={'context_key': 'context_value'}
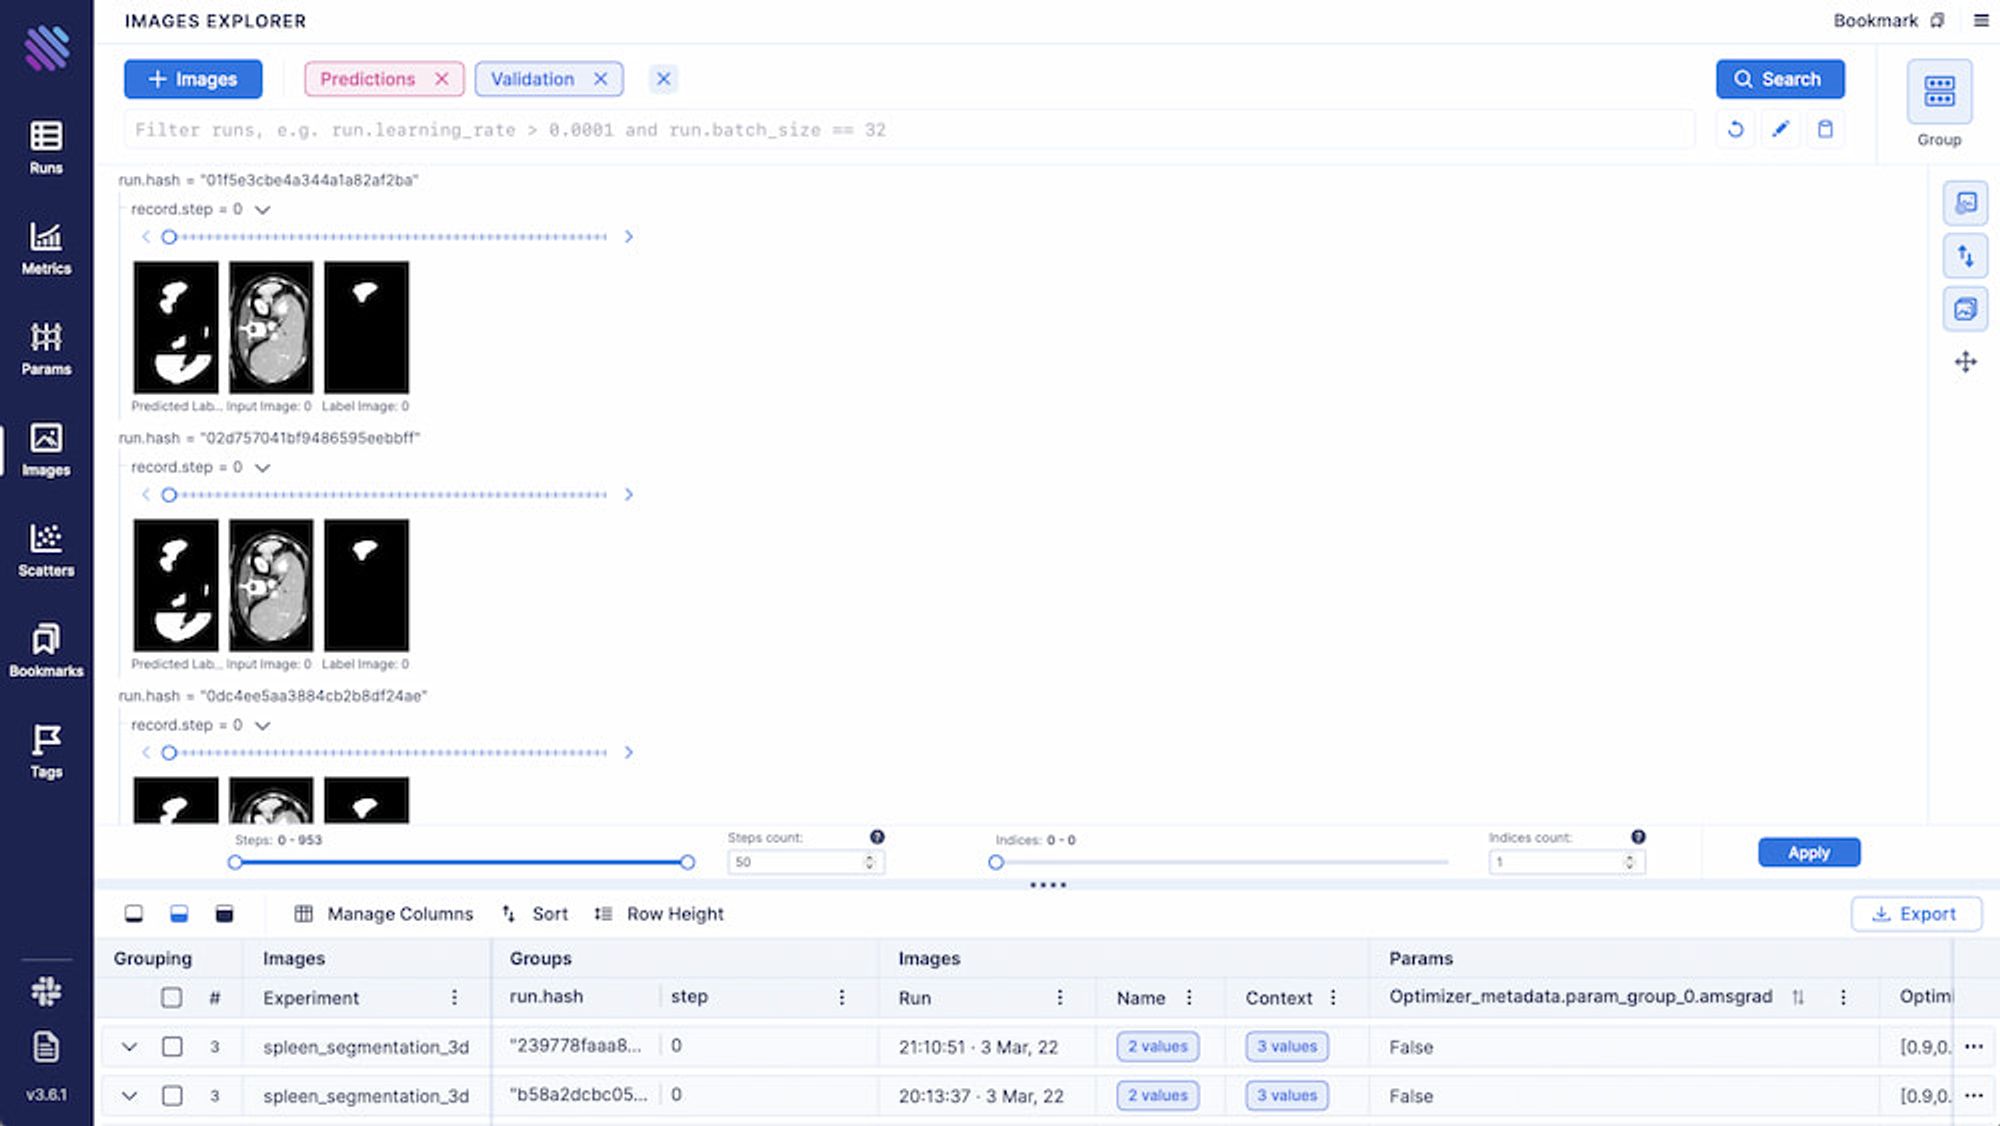
)You can find the complete guide to tracking in the official documentation.
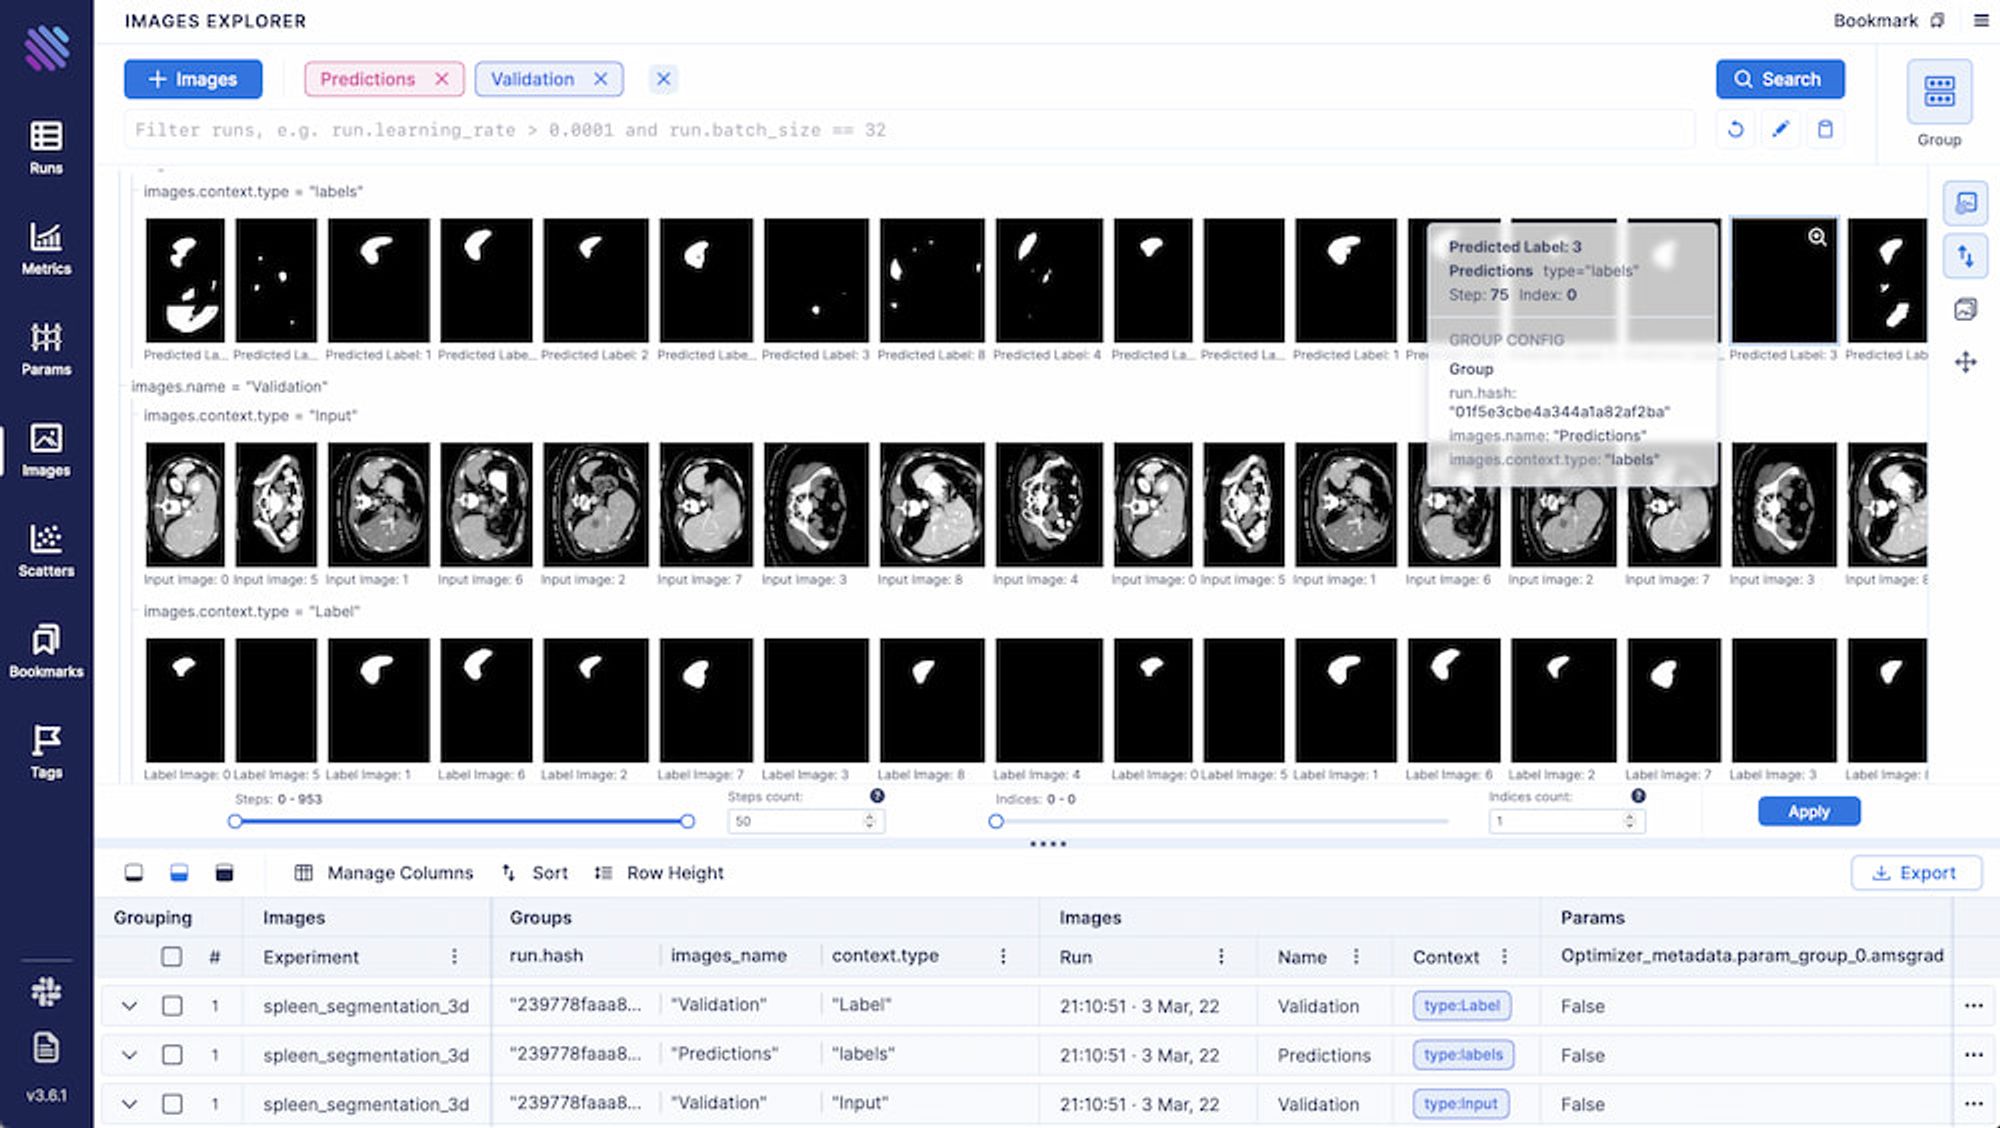
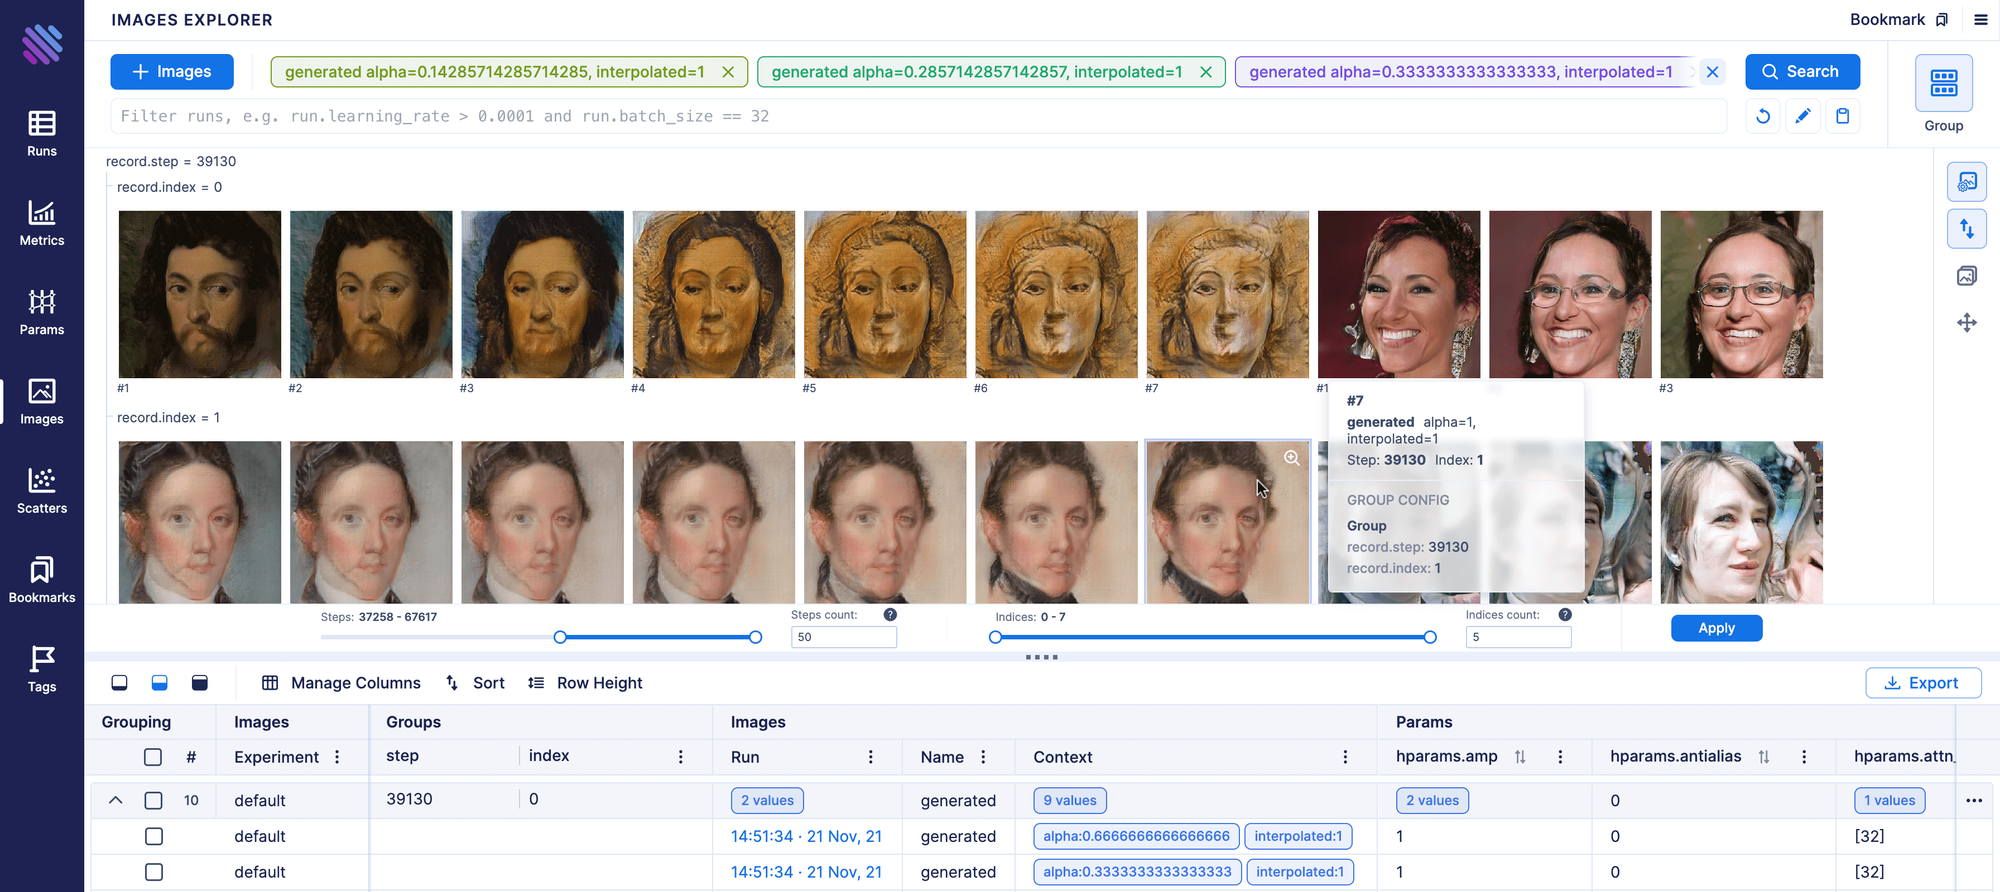
All the grouping/filtering/aggregation functional presented above is also available for Images.
The Figures that one tracked during experimentation can be accessed through the Single Run Page which we will present in the next section.
The grouping is rather flexible with a multitude of options.
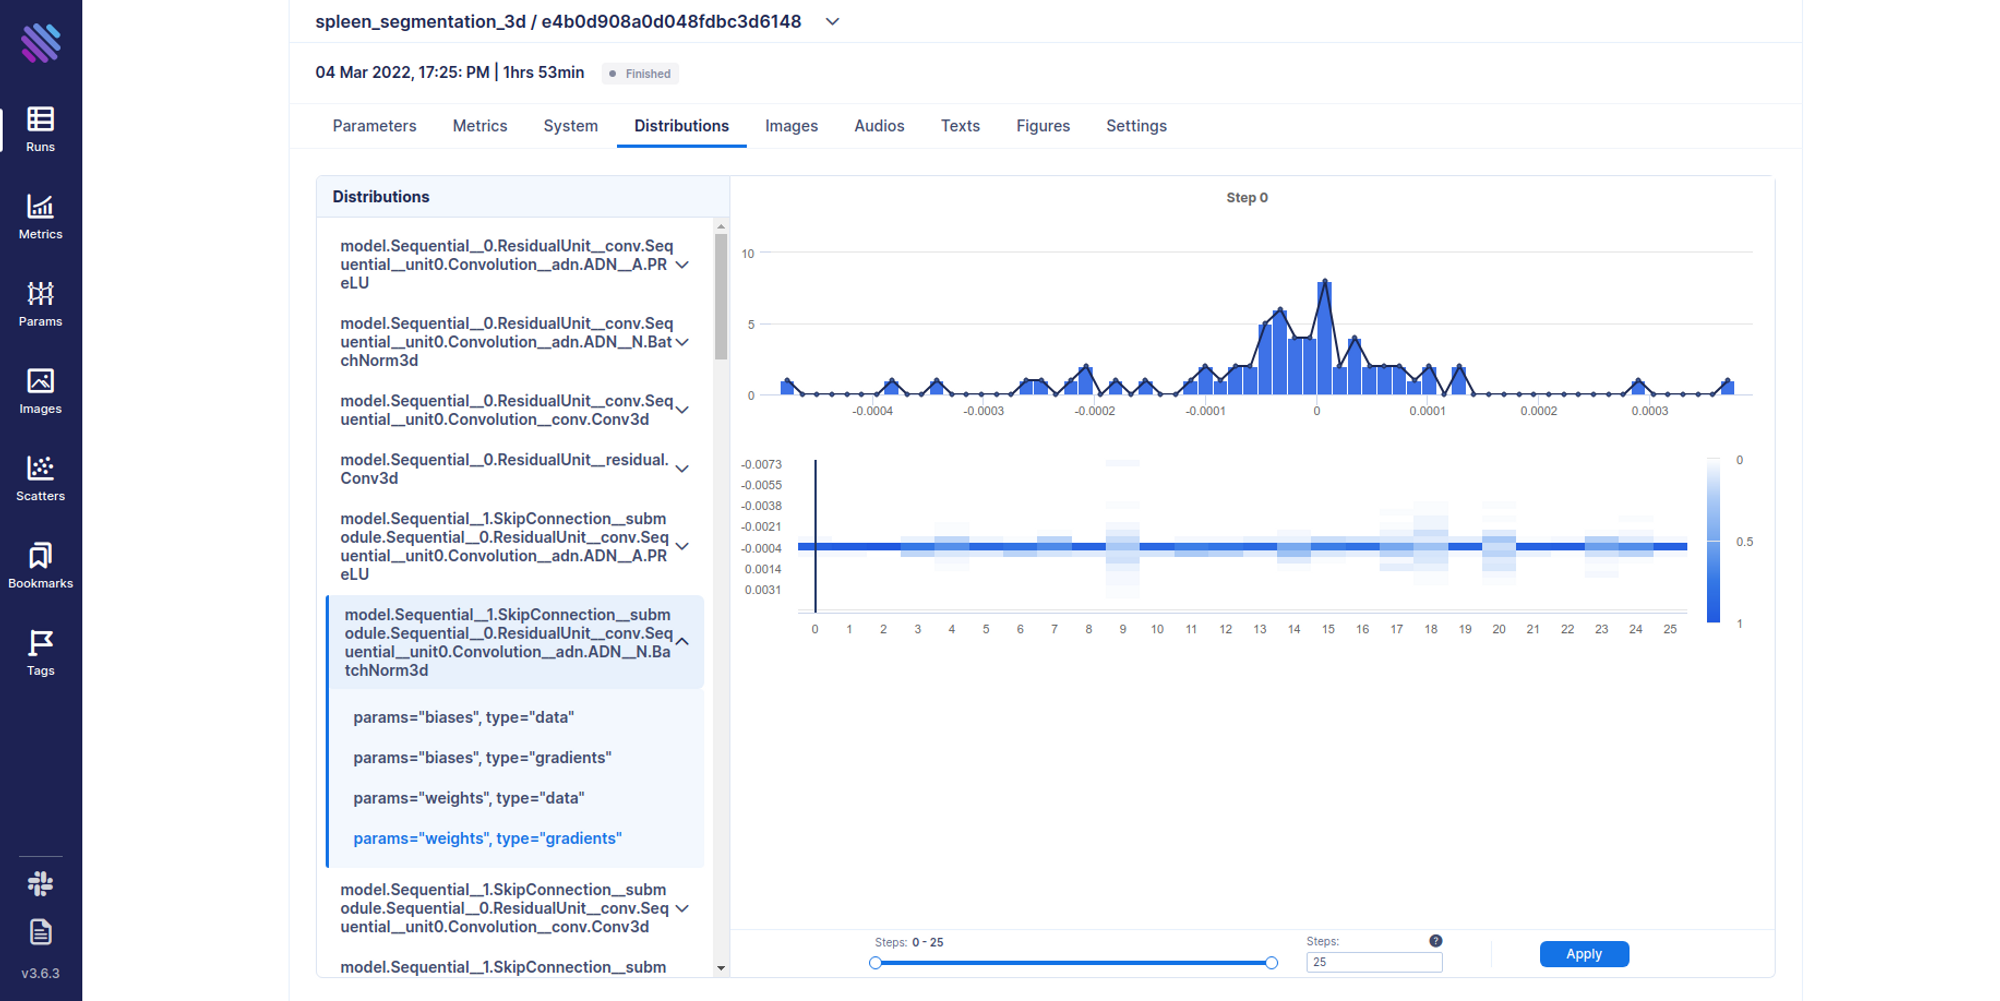
Another interesting thing that one can track is distributions. For example, there are cases where you need a complete hands-on dive into how the weights and gradients flow within your model across training iterations. Aim has integrated support for this.
from aim.pytorch import track_params_dists, track_gradients_dists .... track_gradients_dists(model, aim_run)Distributions can be accessed from the Single Run Page as well.
You can play around with the image and single run explorers and see all the trackables across our numerous Demos (FS2, Spleen Segmentation, Lightweight GAN, Machine Translation).
One Run to rule them all
There are times when a researcher would need to focus upon only a single run of the experiment, where he can iterate through a complete list of all the things he tracked. Aim has a dedicated Single Run Page for this very purpose.
You can view all the trackables in the following Tabs:
- Parameters/ Hyperparametrs – Everything tracked regarding the experiment
- Metrics – All the Tracked Metrics/Losses etc.
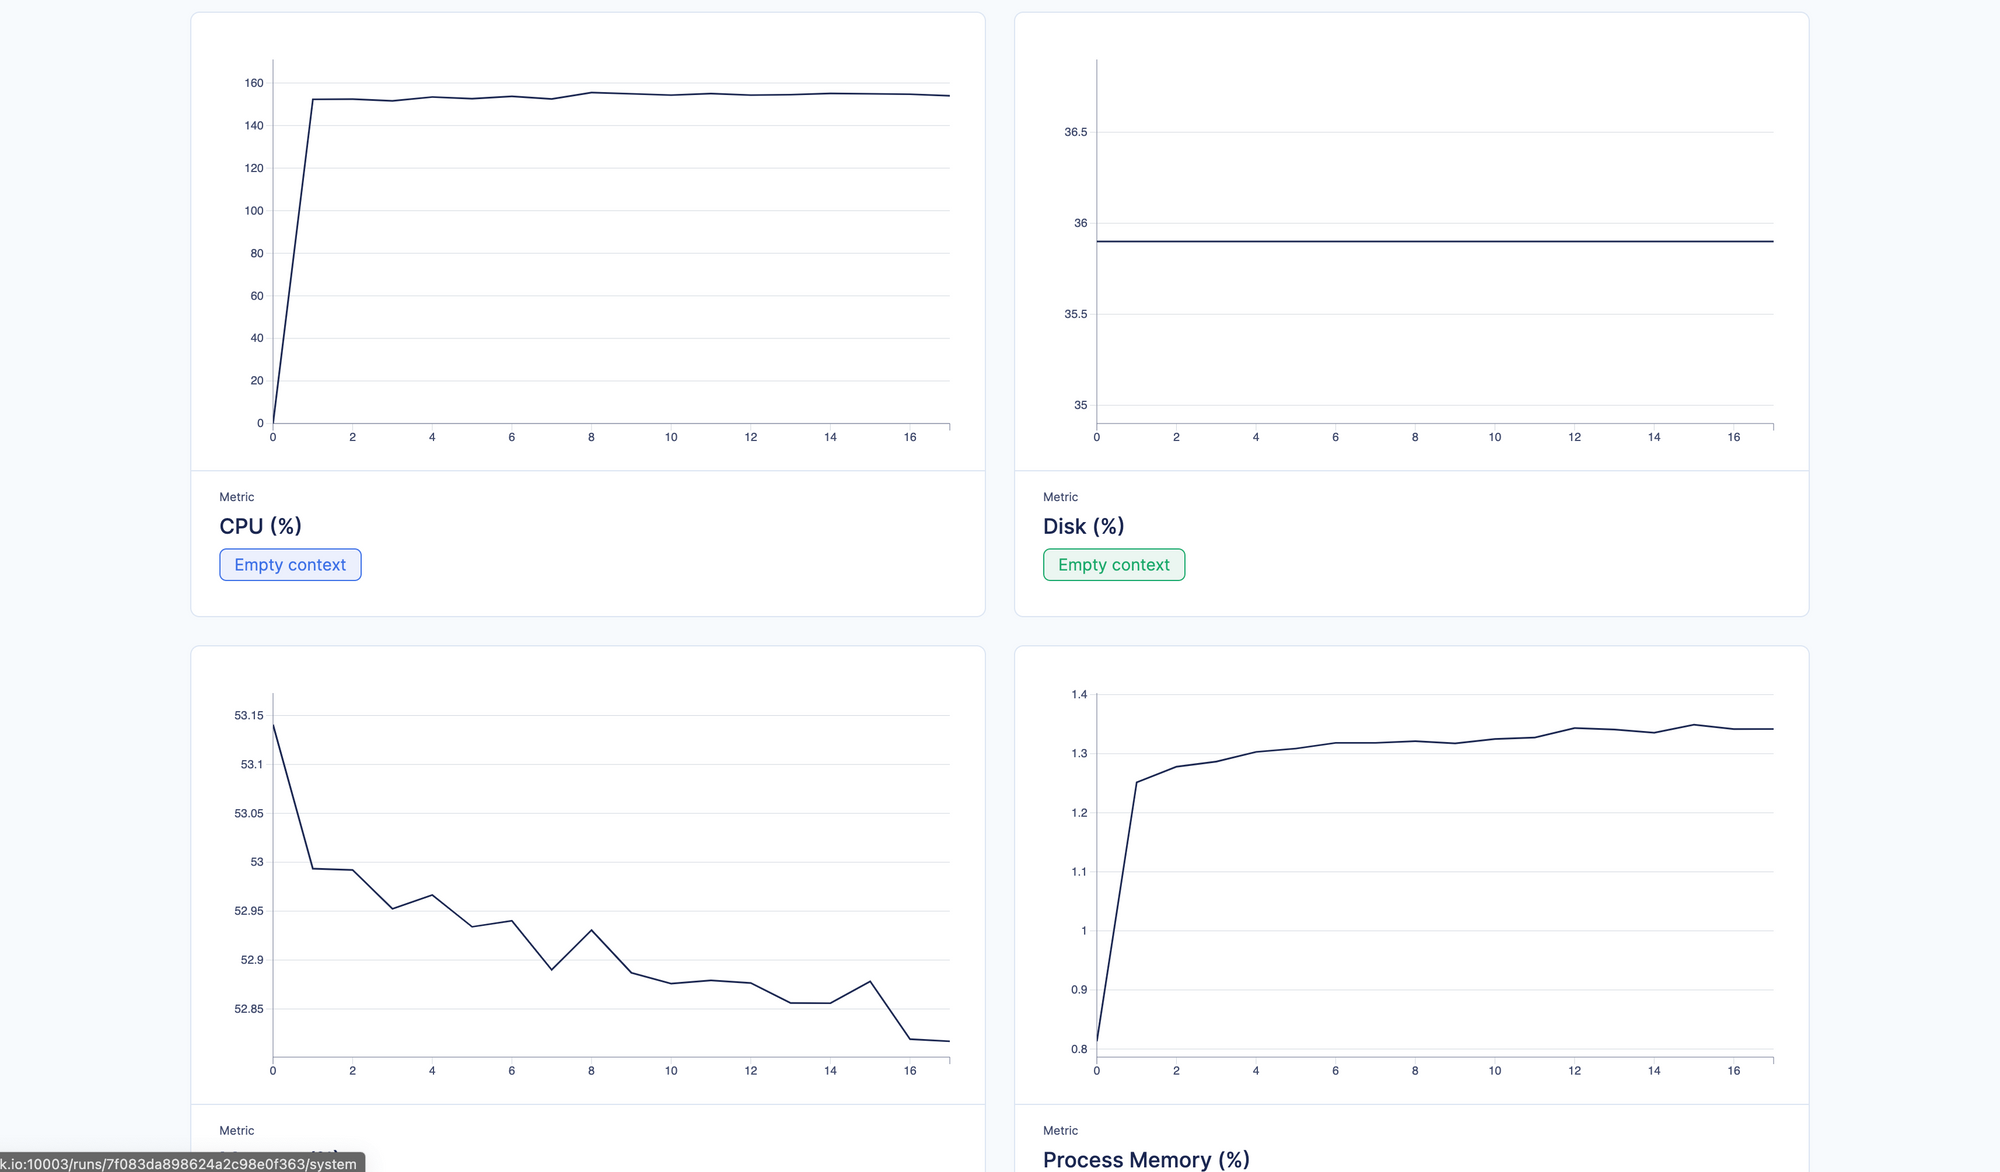
- System – All the system information tracked within the experimentation (CPU/GPU temperature, % used, Disk info etc.)
- Distributions – All the distributions tracked (i.e. Flowing gradients and weights)
- Images – All the Image objects saved
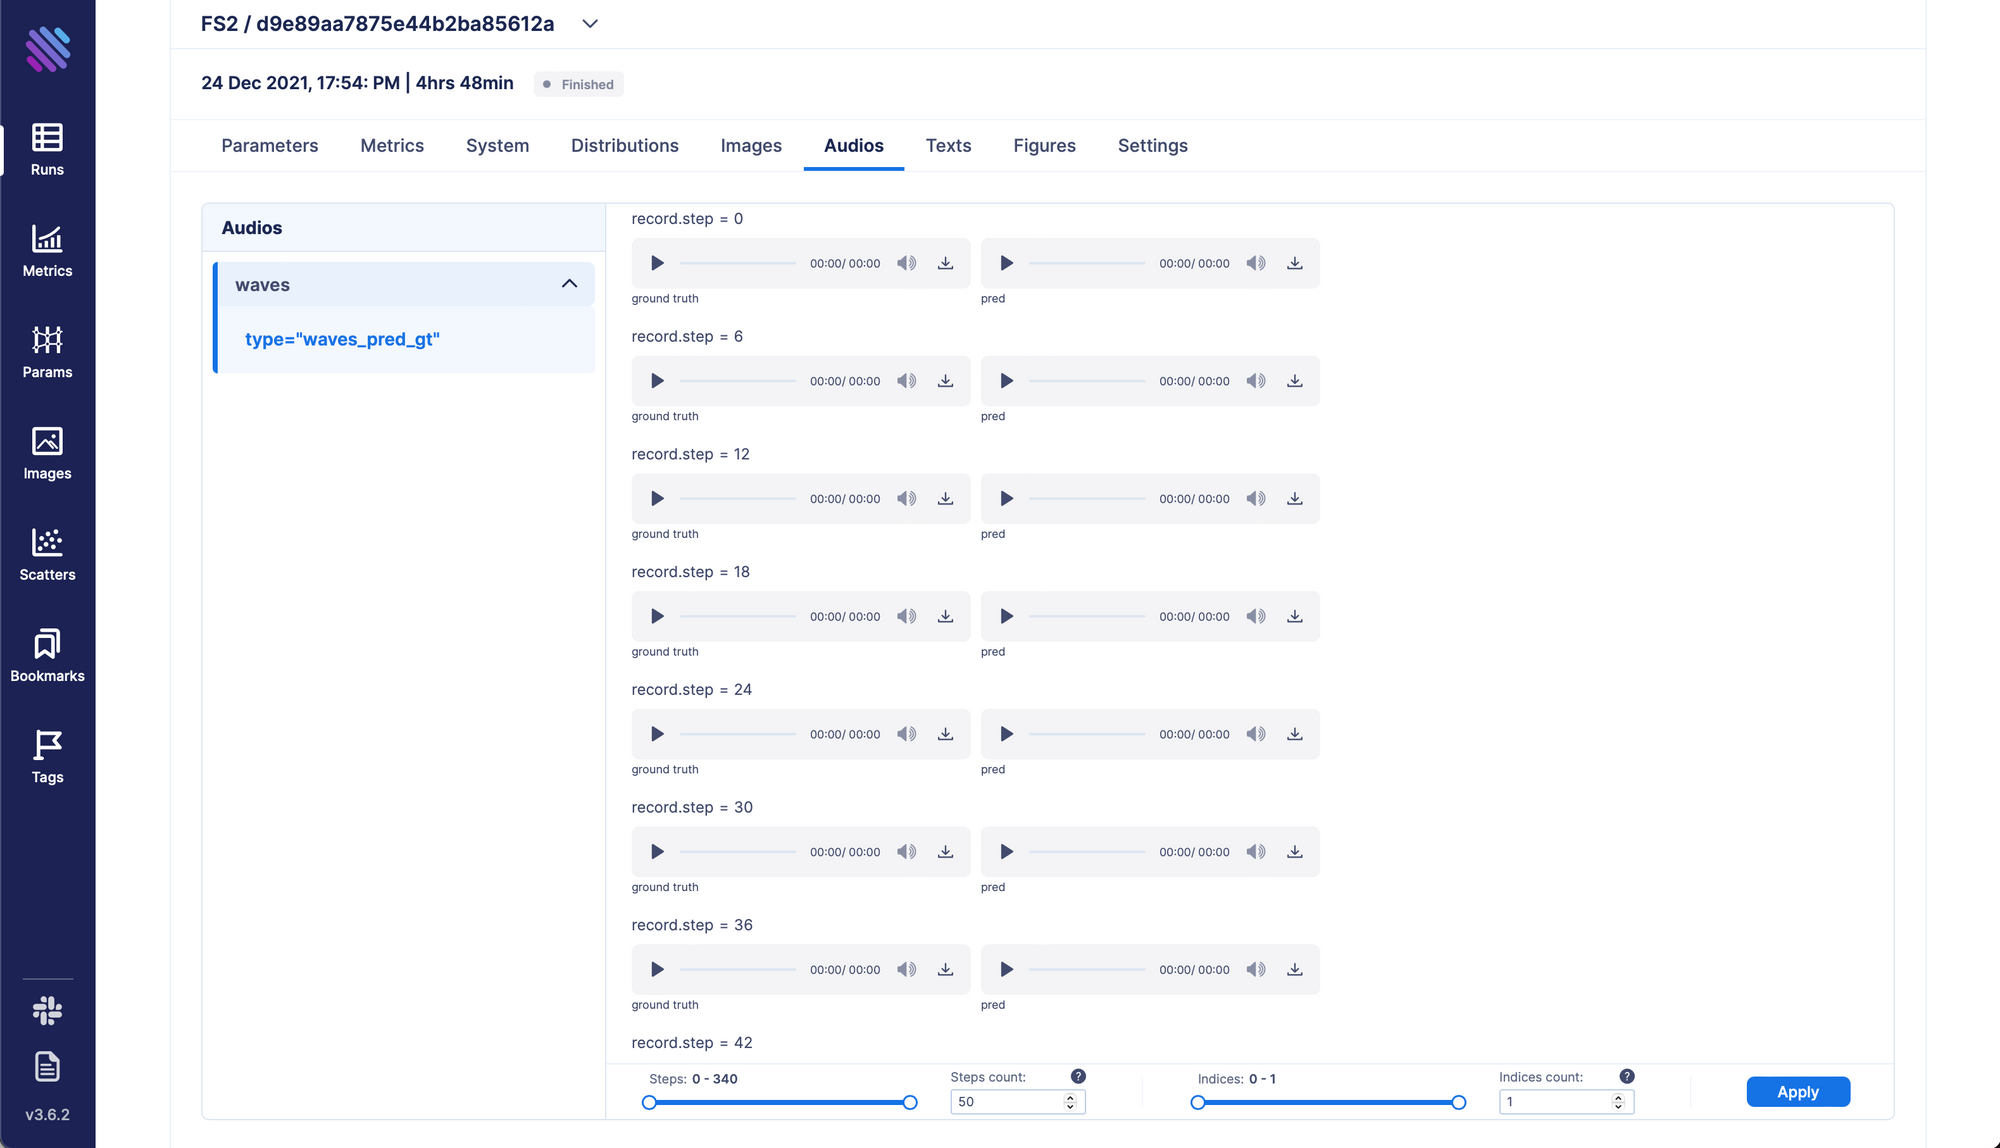
- Audios – All the Audio objects saved
- Texts – All the raw text tracked during experimentation
- Figures – All the
matplotlin/Plotlyetc. Figures - Settings – Settings that runs share
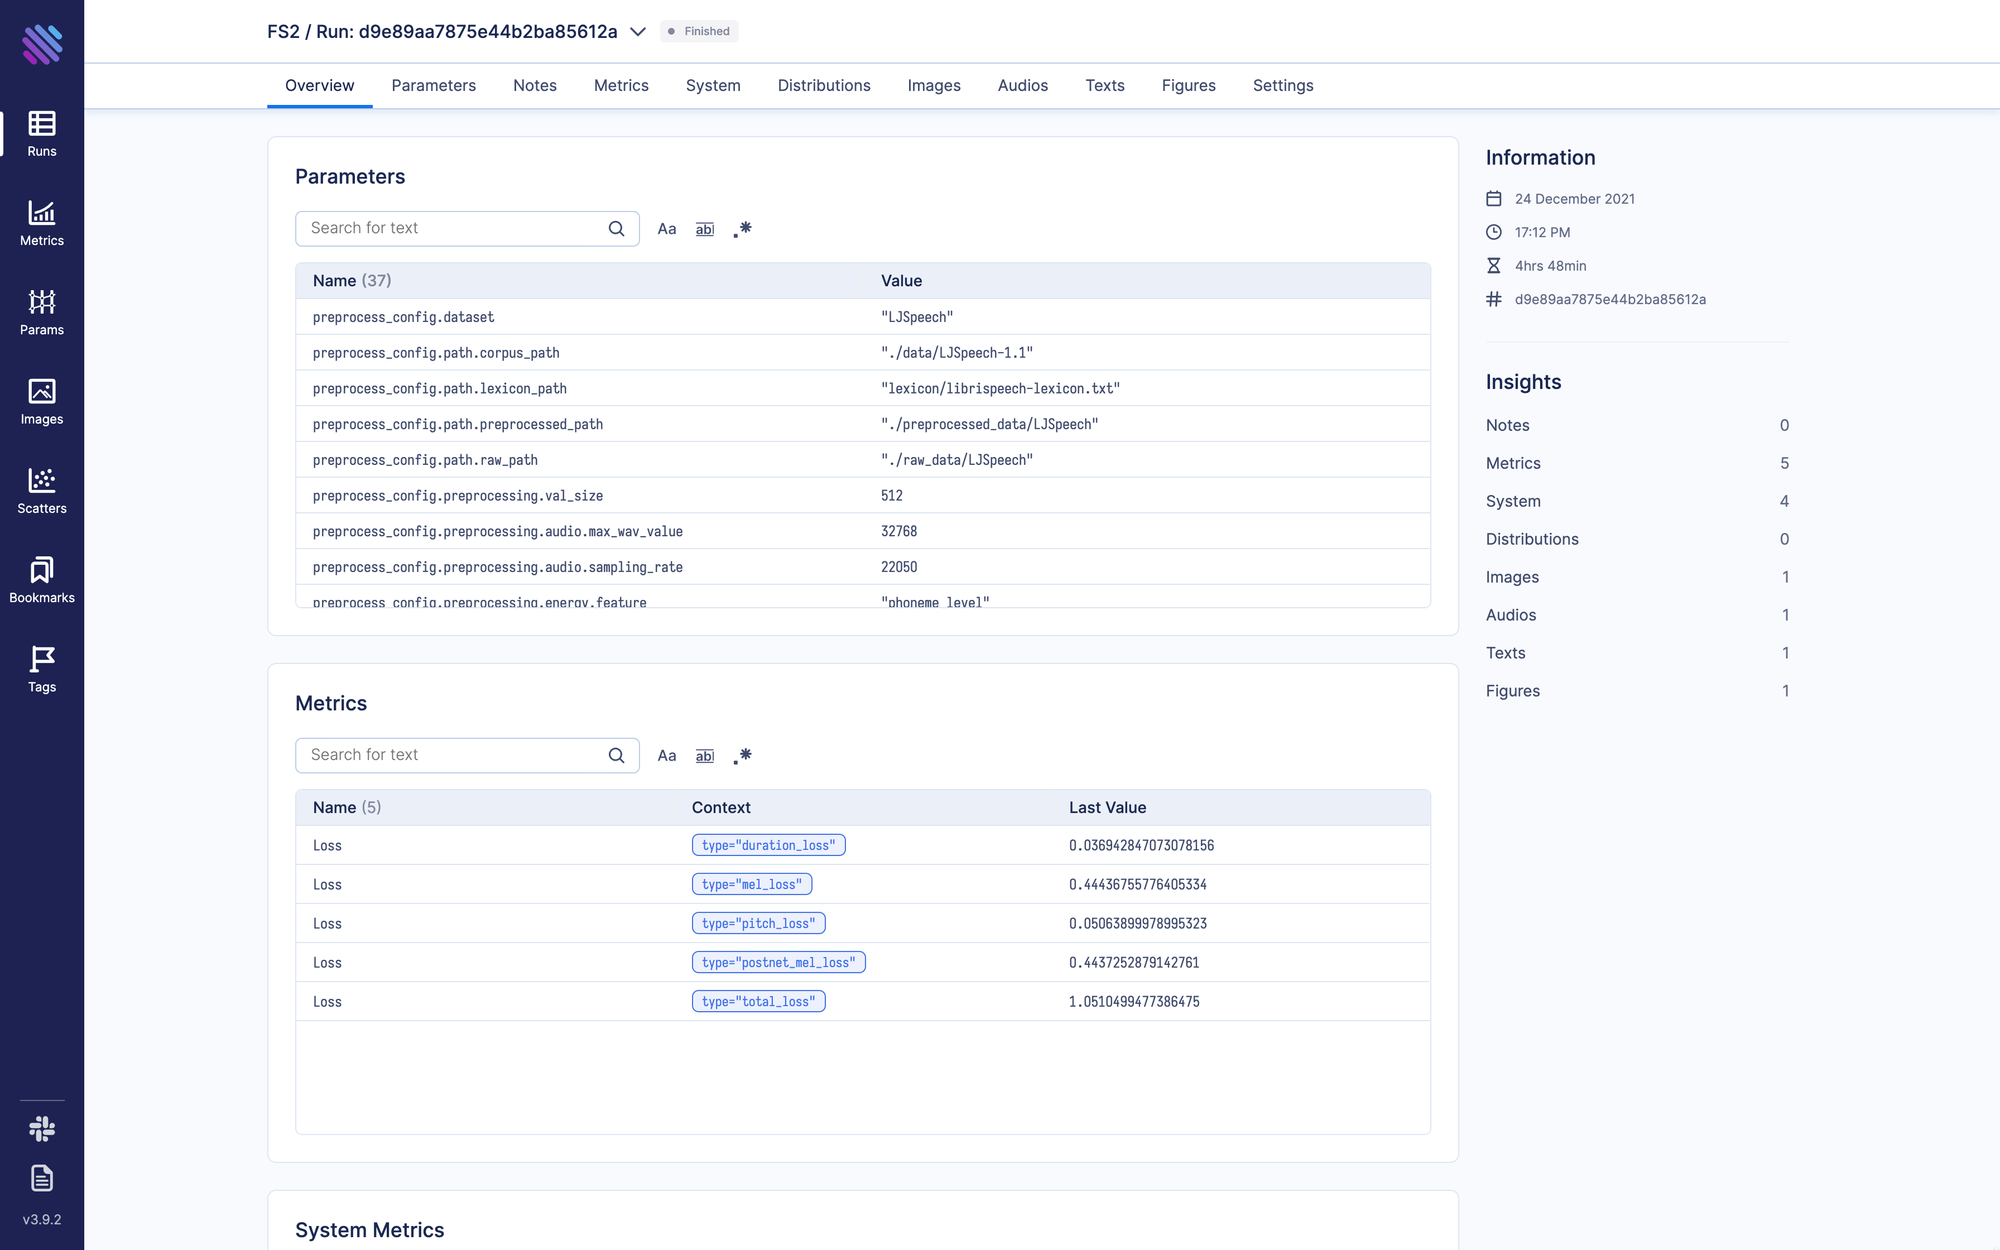
Looking through all these insights iteratively can allow for an in-depth granular assessment of your experimentation. Visually it has the following form
You can look around the individual runs in one of our interactive Demos (FS2, Spleen Segmentation, Lightweight GAN, Machine Translation).
No More localhost. Track experiments remotely
Aim provides an opportunity for users to track their experiments within a secluded server outside of our local environment. Setting up within a server can be easily completed within command line commands
aim init
# Tringgering aim server
aim server --repo <REPO_PATH> --host 0.0.0.0 --port some_open_port
# Tringgering aim UI frontend
aim up --repo <REPO_PATH> --host 0.0.0.0 --port some_open_port
Integrating this newly created remote tracking server within your experimentation is even easier.
# This is an example aim://ip:port
remote_tracking_server = 'aim://17.116.226.20:12345'
# Initialize Aim Run
aim_run = aim.Run(
    experiment='experiment_name',
    repo=remote_tracking_server
)
After this, you can view your experiments tracked live from the ip:port where you hosted Aim UI. Our very own Demos are a clear example of this.
Learn more
Aim is on a mission to democratize AI dev tools.
We have been incredibly lucky to get help and contributions from the amazing Aim community. It’s humbling and inspiring.
Try out Aim, join the Aim community, share your feedback, open issues for new features, bugs.
And don’t forget to leave Aim a star on GitHub for support.