
I am Hovhannes - ML researcher at YerevaNN. Experiment trackers are key for any researchers day-to-day and I have had my fair share of trials and turbulations with them.
I have been using Aim for my projects for the past 6 months and I am addicted to it! So I have put together this basic tutorial on Aim for Wandb users (for my friends!).
There are lots of converters already available to migrate or use along with other experiment trackers: Aim Converters.
Using Aim’s Explorers along with your Wandb dashboard is easy. Aim allows you to convert Weights & Biases (wandb) runs into the native format and explore them via Aim UI.
In this blog/post we will go over the steps required to migrate wandb logs to Aim. For that, we will use a sample project.
Example Project Setup
Let’s take a look at a concrete example. We will be using keras-tuner to train a CNN on Cifar10 dataset. Create a project and track the experiments using wandb. We will set the team name/entity to be sample-team:
import wandb
from wandb.keras import WandbCallback
wandb.init(project="my-awesome-project")
Model creation, data loading and other parts can be done as:
import tensorflow as tf
import tensorflow_datasets as tfds
import kerastuner as kt

def build_model(hp):
    inputs = tf.keras.Input(shape=(32, 32, 3))
    x = inputs
    for i in range(hp.Int("conv_blocks", 3, 5, default=3)):
        filters = hp.Int("filters_" + str(i), 32, 256, step=32)
        for _ in range(2):
            x = tf.keras.layers.Convolution2D(filters, kernel_size=(3, 3), padding="same")(x)
            x = tf.keras.layers.BatchNormalization()(x)
            x = tf.keras.layers.ReLU()(x)
        if hp.Choice("pooling_" + str(i), ["avg", "max"]) == "max":
            x = tf.keras.layers.MaxPool2D()(x)
        else:
            x = tf.keras.layers.AvgPool2D()(x)
    x = tf.keras.layers.GlobalAvgPool2D()(x)
    x = tf.keras.layers.Dense(hp.Int("hidden_size", 30, 100, step=10, default=50), activation="relu")(x)
    x = tf.keras.layers.Dropout(hp.Float("dropout", 0, 0.5, step=0.1, default=0.5))(x)
    outputs = tf.keras.layers.Dense(10, activation="softmax")(x)

    model = tf.keras.Model(inputs, outputs)
    model.compile(
        optimizer=tf.keras.optimizers.Adam(
            hp.Float("learning_rate", 1e-4, 1e-2, sampling="log")
        ),
        loss="sparse_categorical_crossentropy",
        metrics=["accuracy"],
    )
    return model


tuner = kt.Hyperband(
    build_model, objective="val_accuracy", max_epochs=30, hyperband_iterations=2
)

data = tfds.load("cifar10")
train_ds, test_ds = data["train"], data["test"]


def standardize_record(record):
    return tf.cast(record["image"], tf.float32) / 255.0, record["label"]


train_ds = train_ds.map(standardize_record).cache().batch(64).shuffle(10000)
test_ds = test_ds.map(standardize_record).cache().batch(64)

tuner.search(
    train_ds,
    validation_data=test_ds,
    callbacks=[WandbCallback(tuner=tuner)],
)

best_model = tuner.get_best_models(1)[0]
best_hyperparameters = tuner.get_best_hyperparameters(1)[0]
This code snippet should train multiple CNNs, by varying their parameters. After the parameter search and the training is succeeded let’s convert these runs to Aim format, and store it in an Aim repo after which we will explore the same experiment on both UIs.
Note: During this project I noticed that the
wandb.keras.WandbCallbackwas tracking the metrics on epoch end. For better experience we recommend using theaim.keras_tuner.AimCallback: to track all the metrics on batch end.
Converting runs from Wandb to Aim
To be able to explore Weights & Biases (wandb) runs with Aim, please run the wandb to Aim converter. All the metrics, tags, config, artifacts, and experiment descriptions will be converted and stored in the .aim repo.
Pick a directory where our .aim repo will be initialized and navigate to it, after which init an empty aim repo by simply doing:
$ aim initTo start converting wandb experiments from entity/team: sample-team and project: my-awesome-project run:
$ aim convert wandb --entity sample-team --project my-awesome-projectThe converter will iterate over all the experiments in the project my-awesome-project and create a distinct Aim run for each experiment.
For more please see the “Show Weights and Biases logs in Aim” section in Aim docs.
Now that we have our Aim repository initialized, we simply need to do:
$ aim upto start the Aim UI.
Exploring the differences in Aim and wandb UIs
To see the configs, metadata and more on wandb we need to navigate to the “Overview” page:

Under the Config section, our logged configurations are shown. On the Summary page the metrics’ latest results.
The wandb run “Overview” page counterpart on Aim UI is the individual run page, which can be accessed from the “Runs” page:
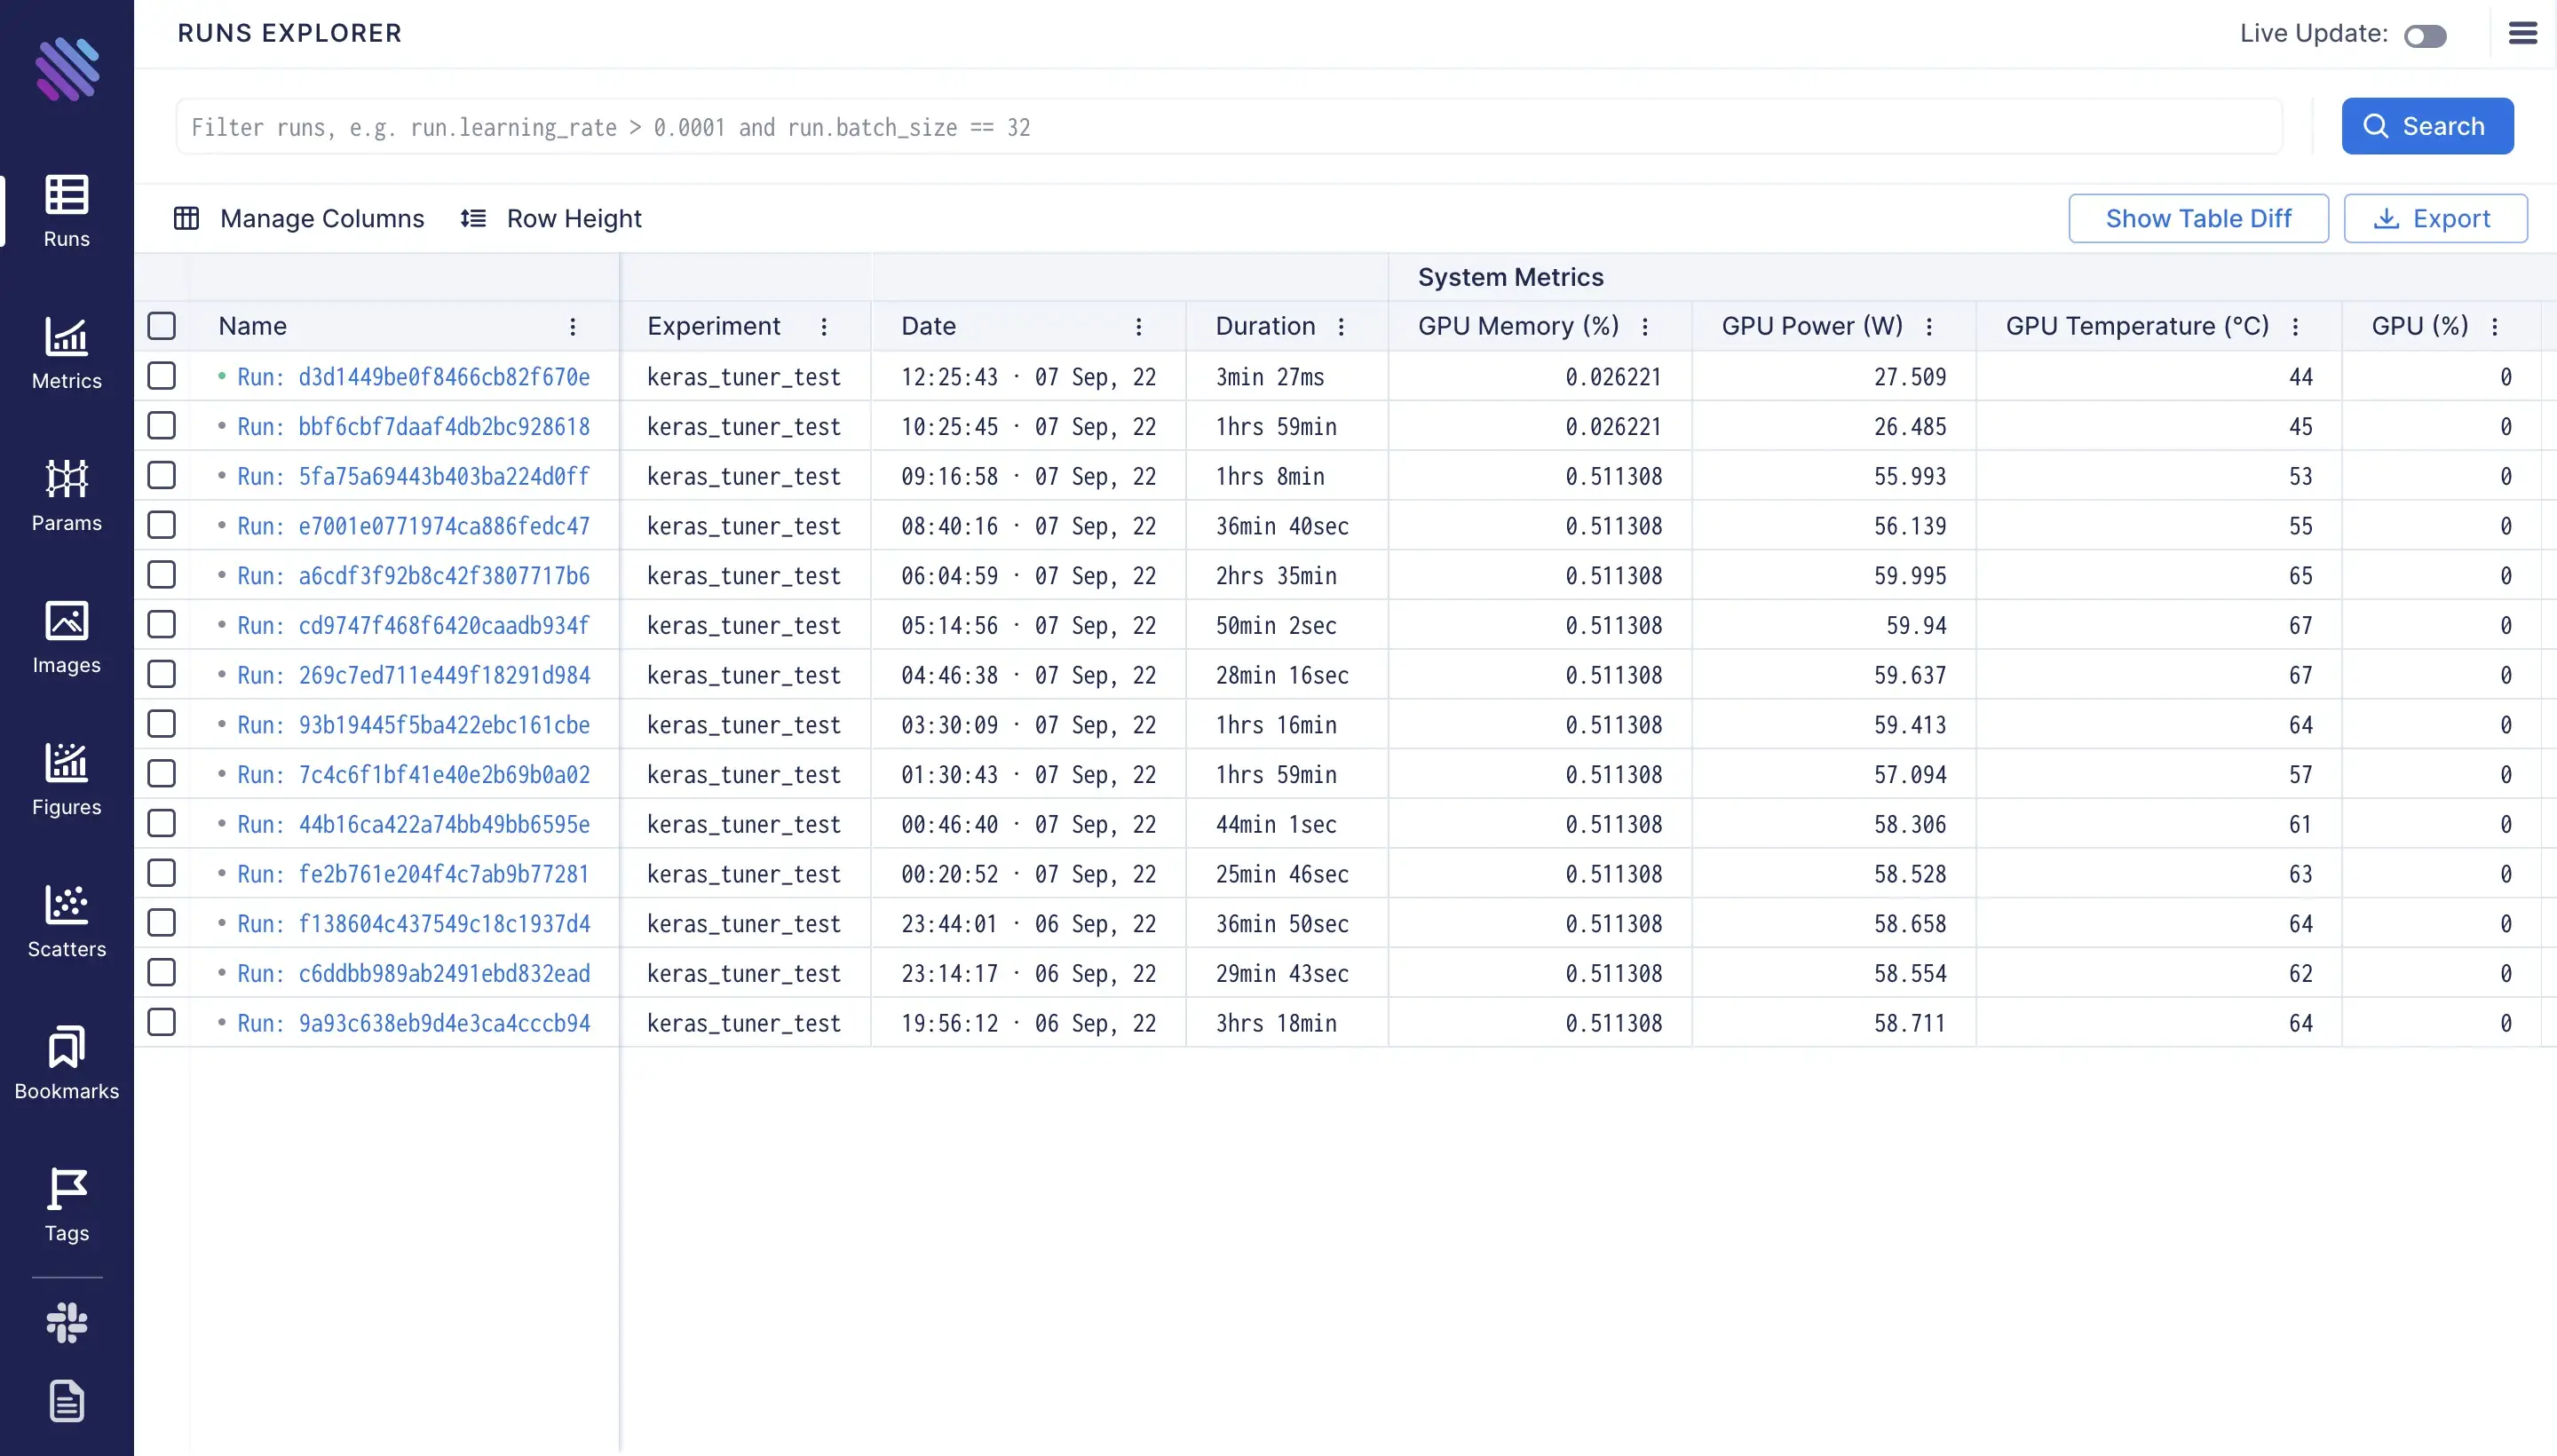
More information can be found when opening an individual run’s overview page.
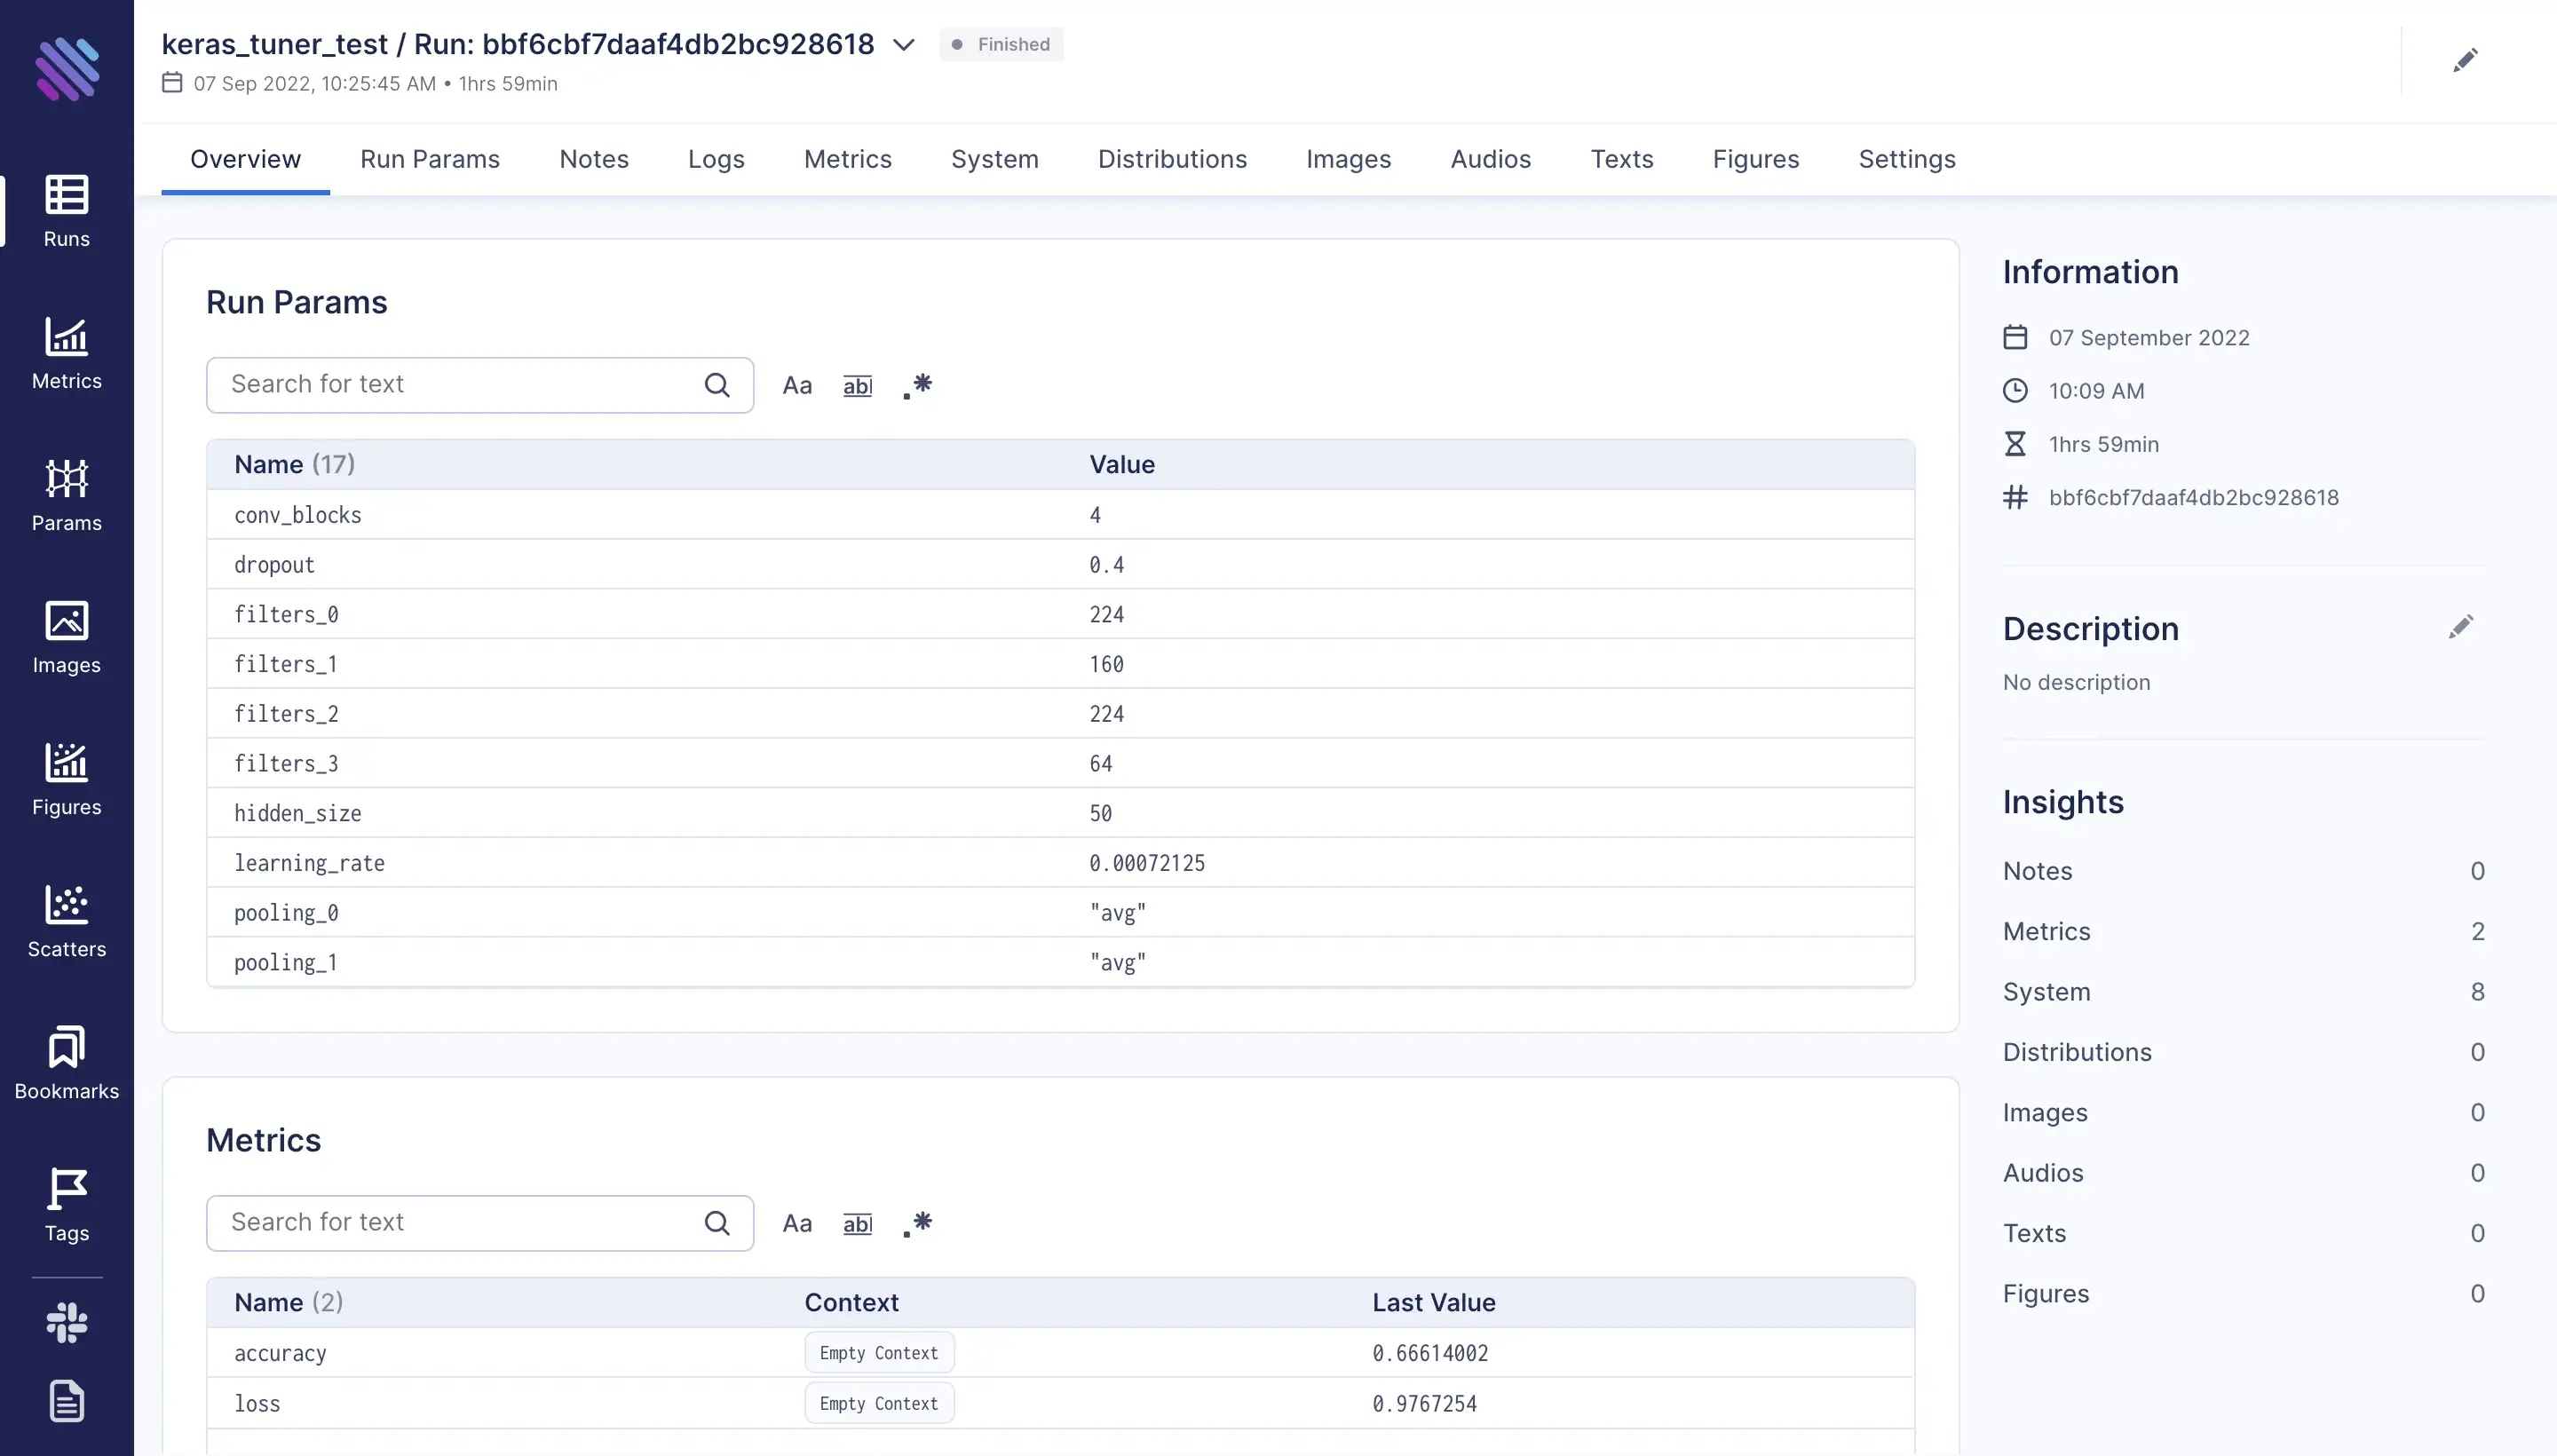
On this page we can see the params, even the wandb_run_id and the wandb_run_name which are extracted from wandb runs during the conversion process.
More detailed information about the run can be found on each of the tabs, e.g. “Run Params”, “Metrics”, “System” etc.
Filtering and Grouping the Metrics
One of the main difference between wandb and aim UIs is that wandb by default presents each metric of each run on a separate plot. Meanwhile aim does exactly the opposite. The metrics are grouped by default and one needs to regroup them into smaller logical parts by their needs.
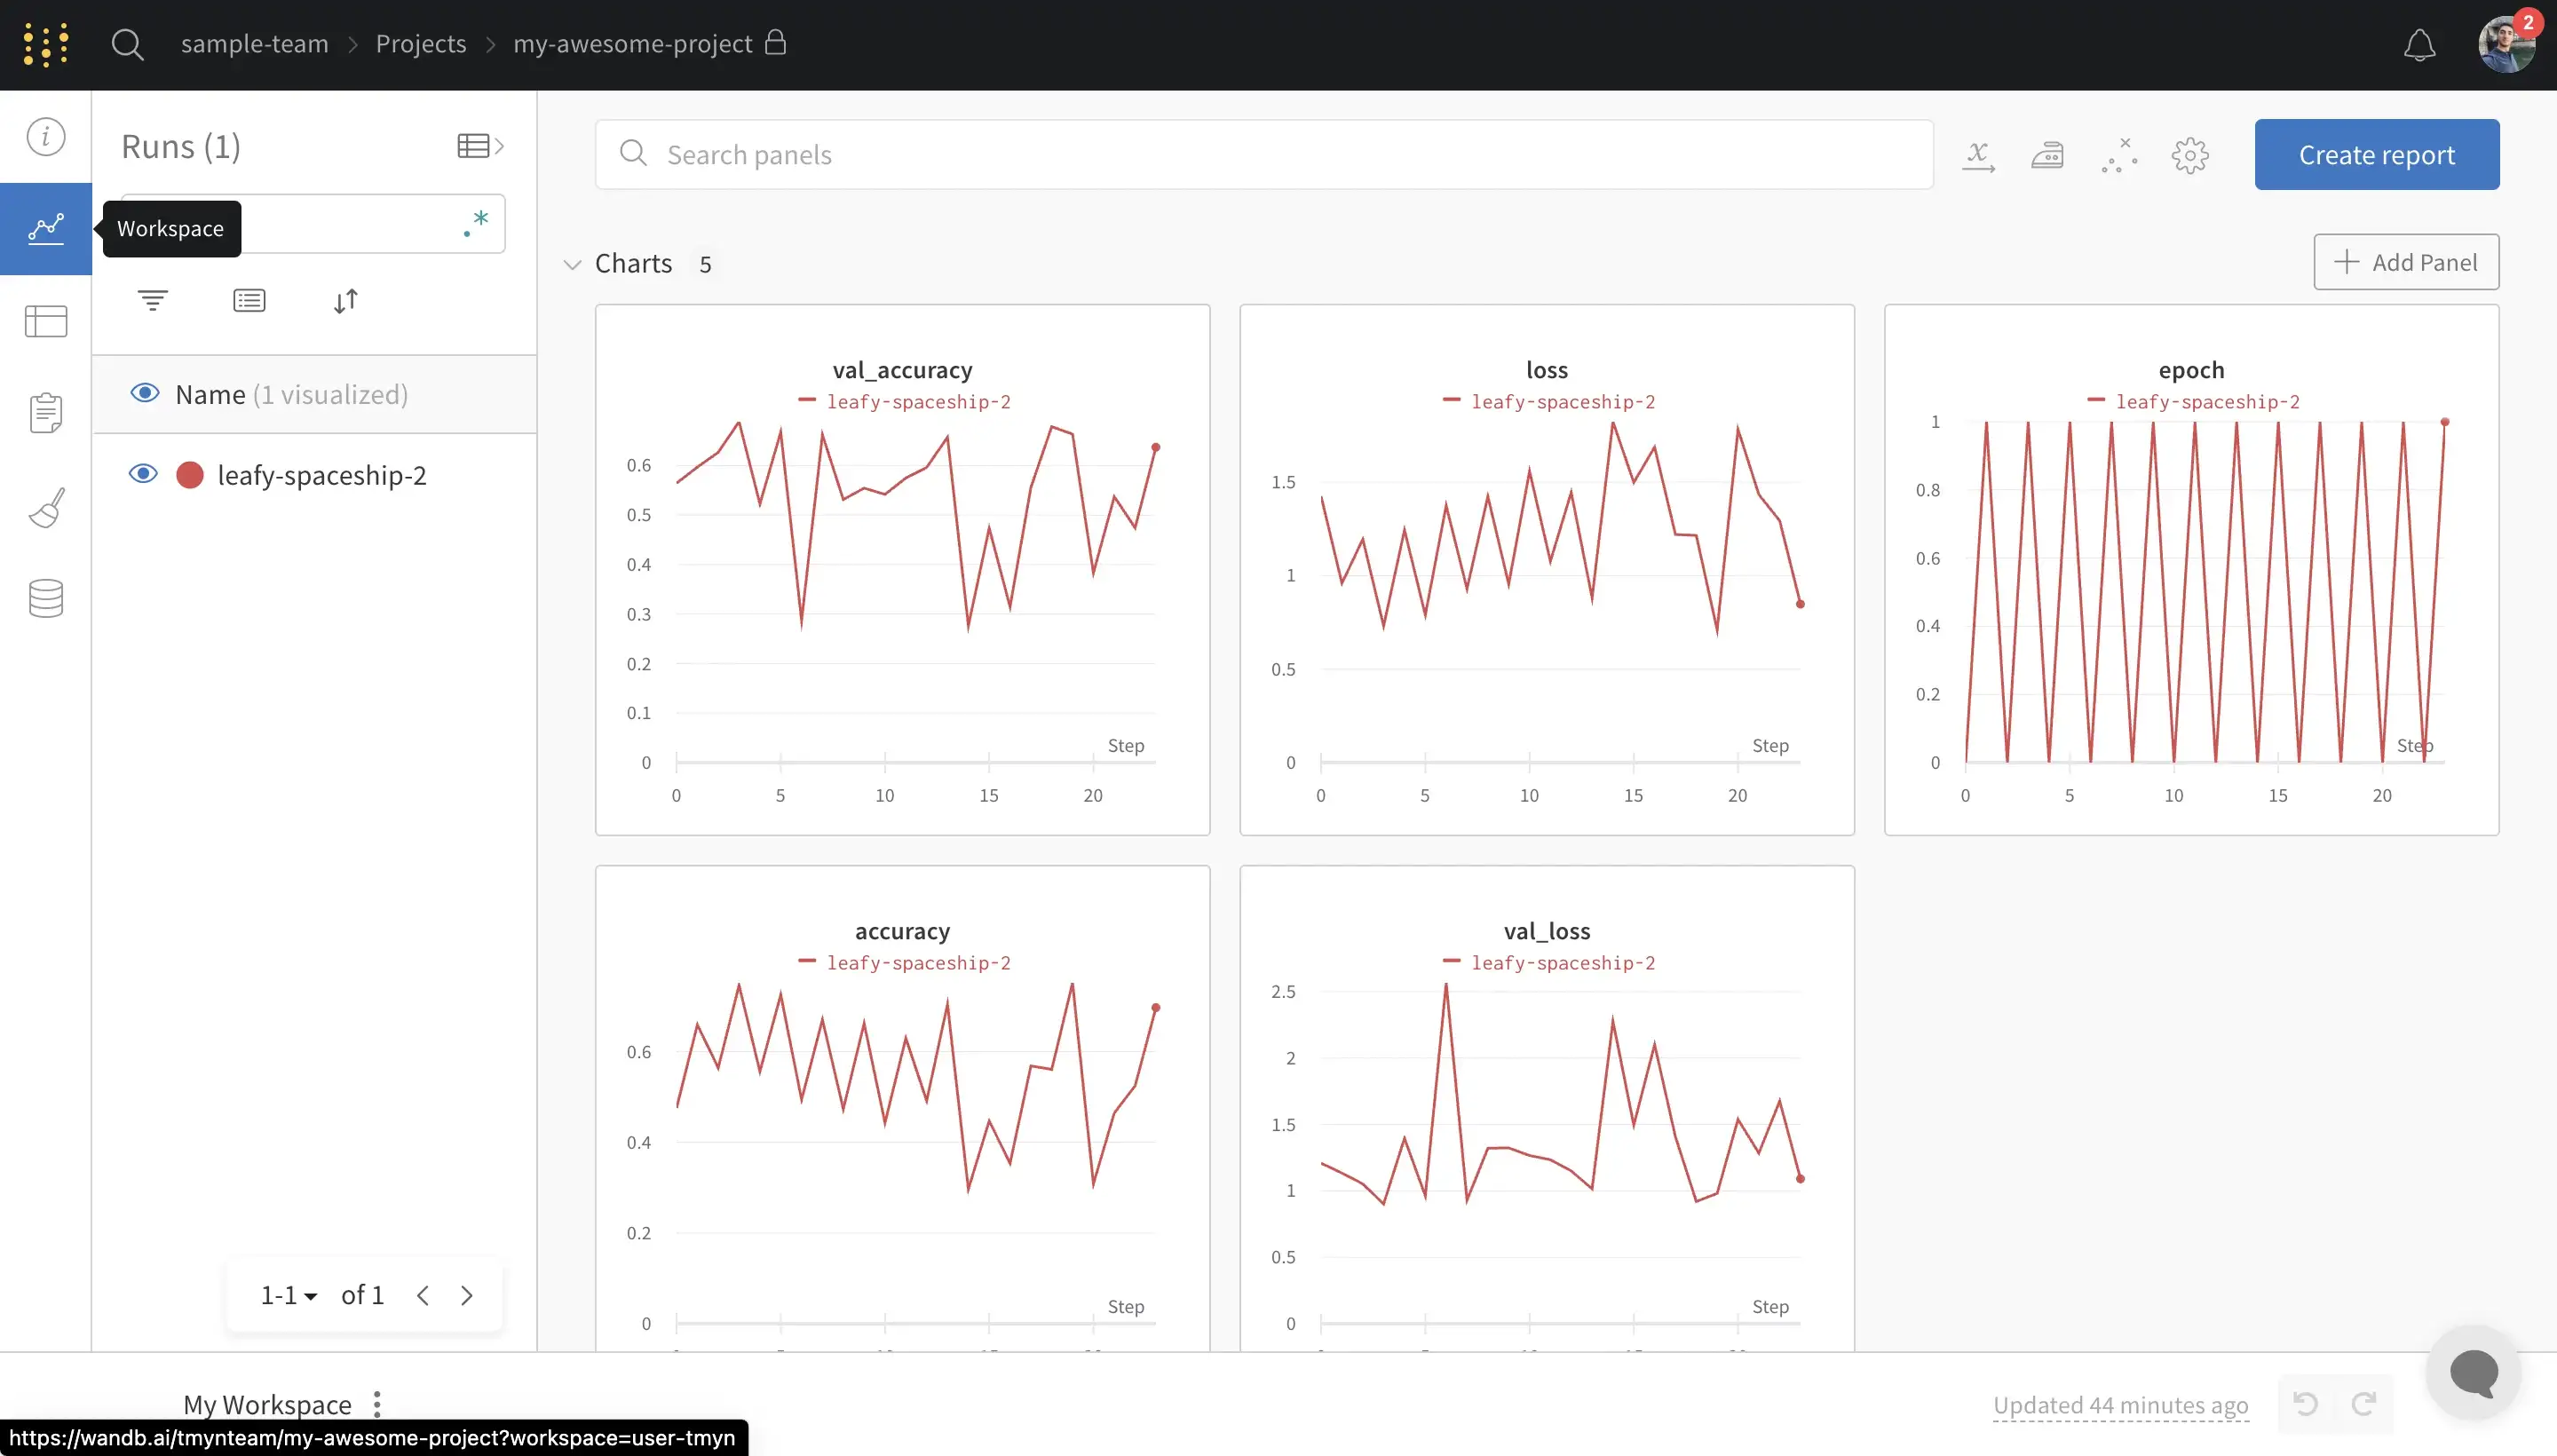
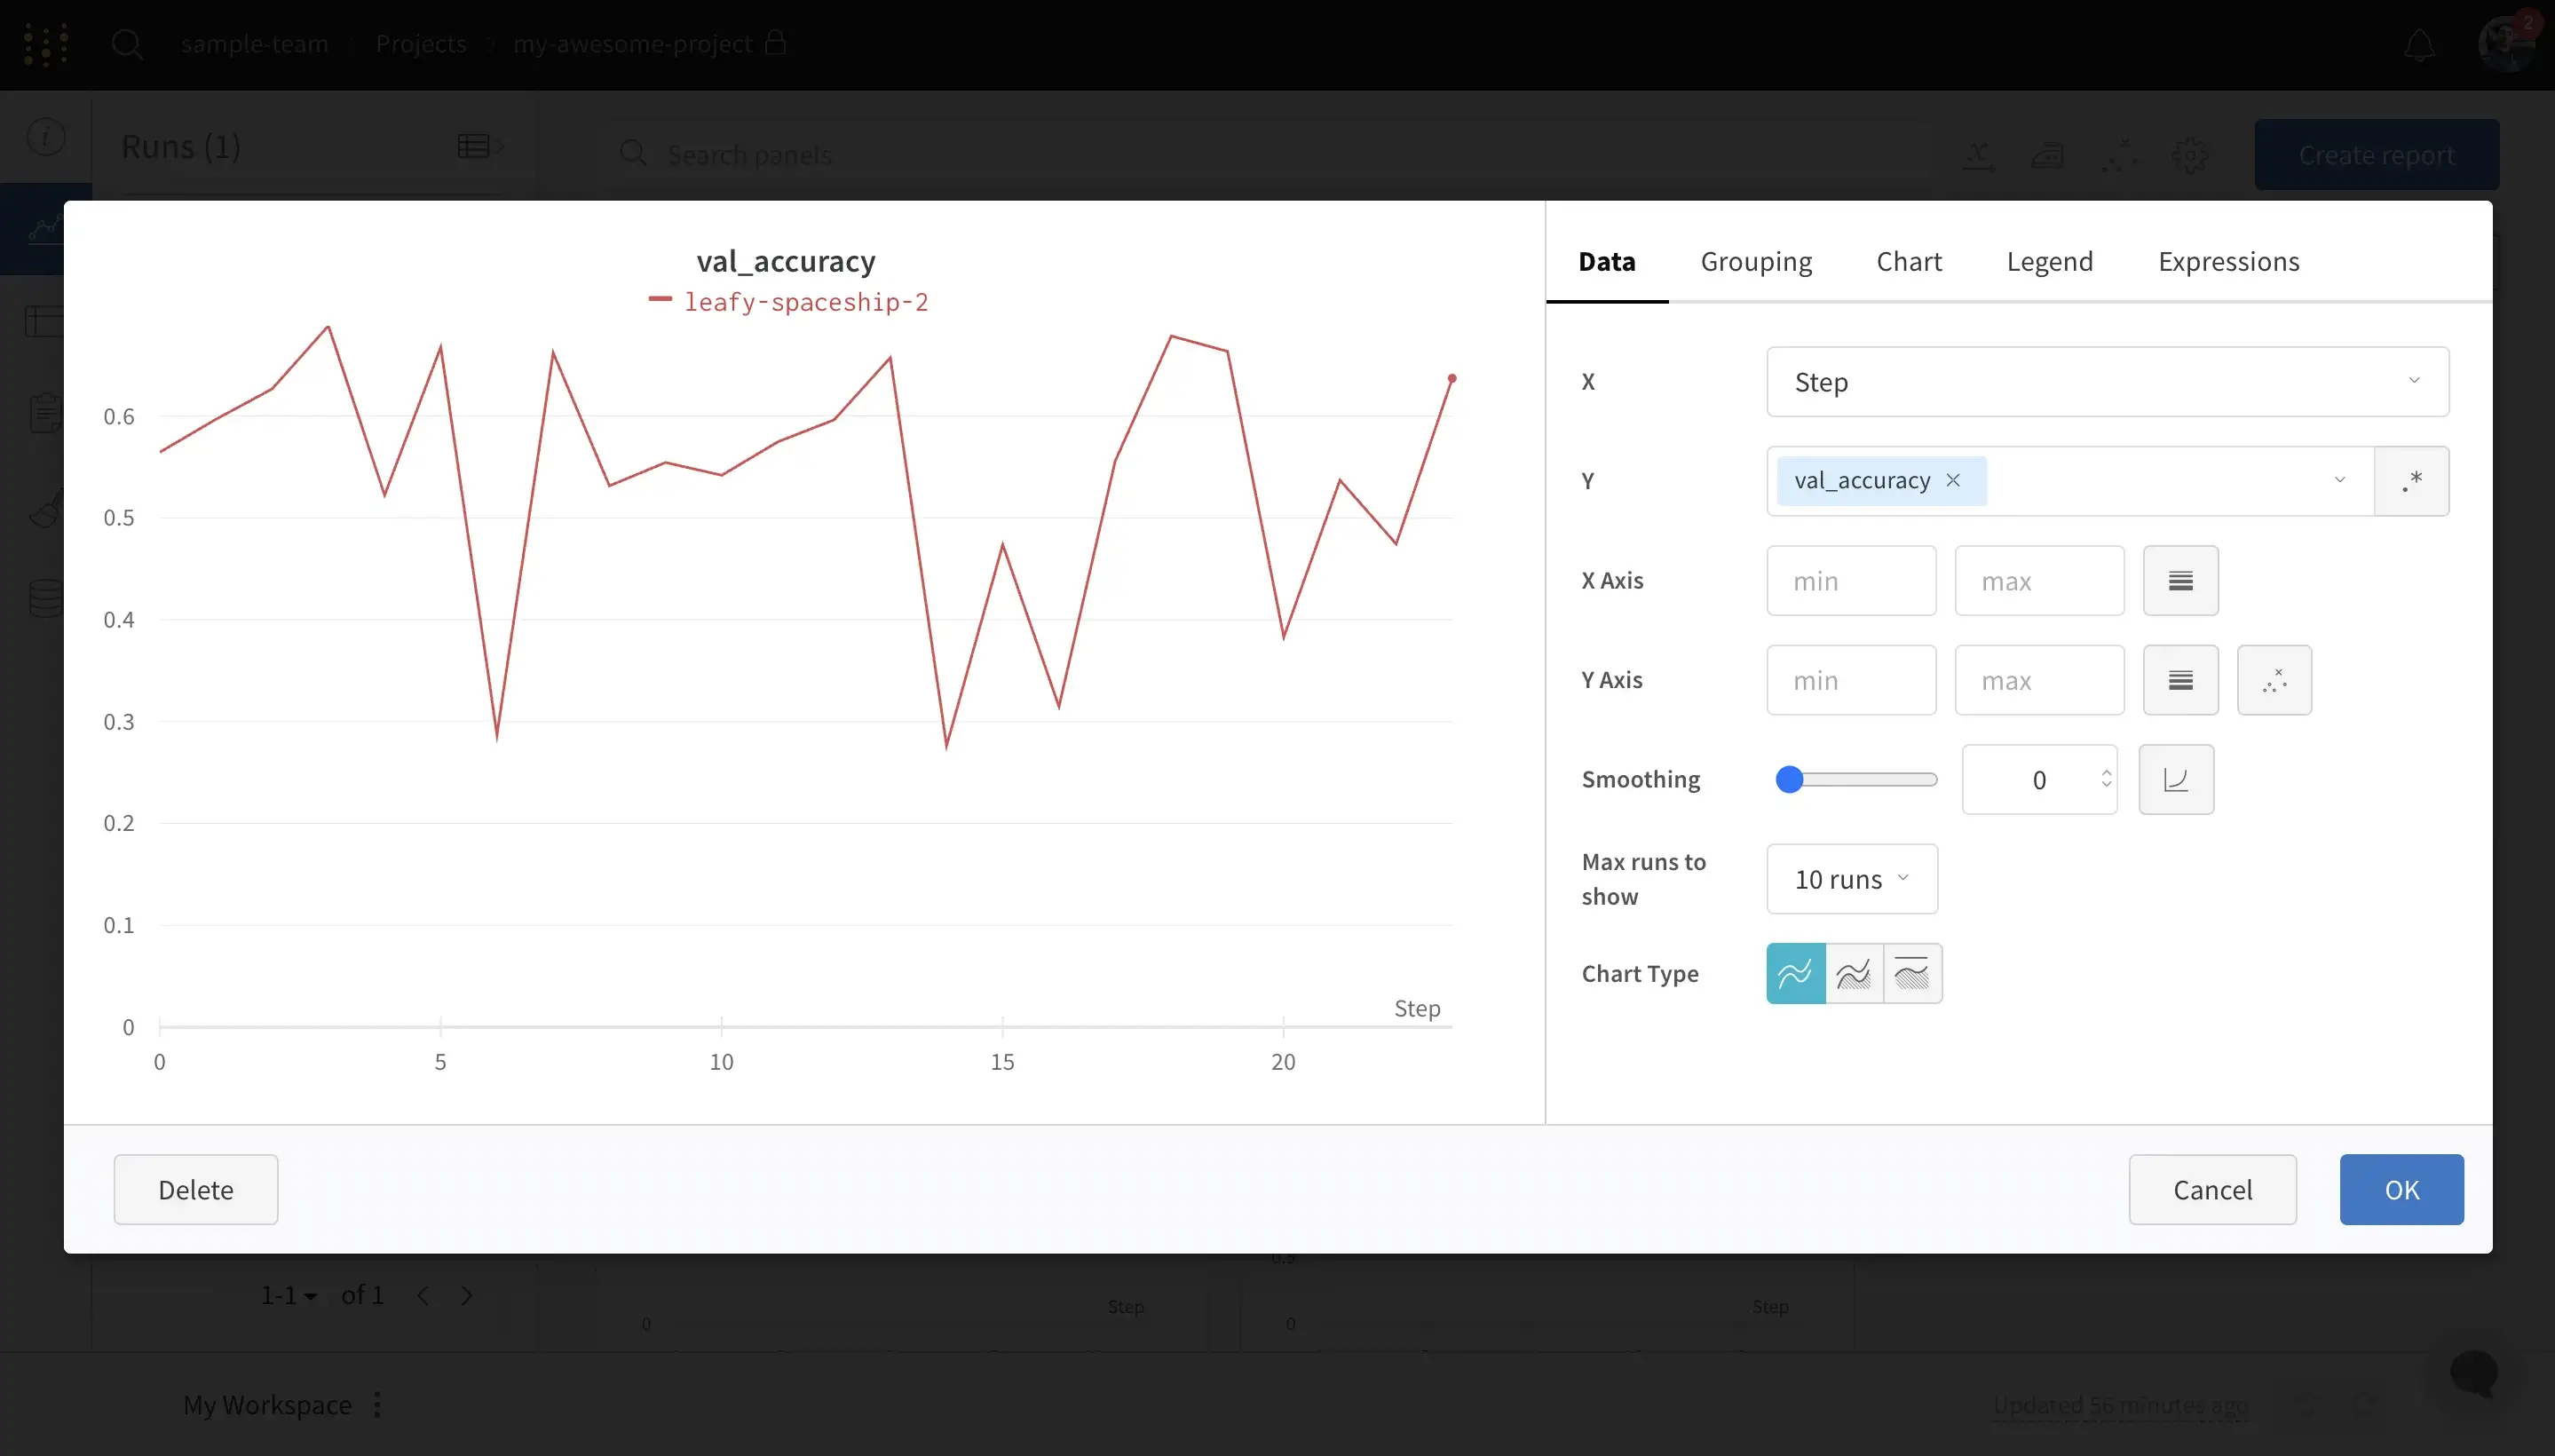
To see the tracked metrics and compare them with other runs we need to open the “Workspace” page on wandb:
To see the metrics on Aim you need to navigate to the “Metrics” page. By default you will see an empty page with “no results” message (which I hope they make this experience better soon), this is because we haven’t selected any metrics to show. To do that we can use the “+ Metrics” button to open up the list of available metrics and select the desired metrics, e.g. “loss” and “accuracy”:
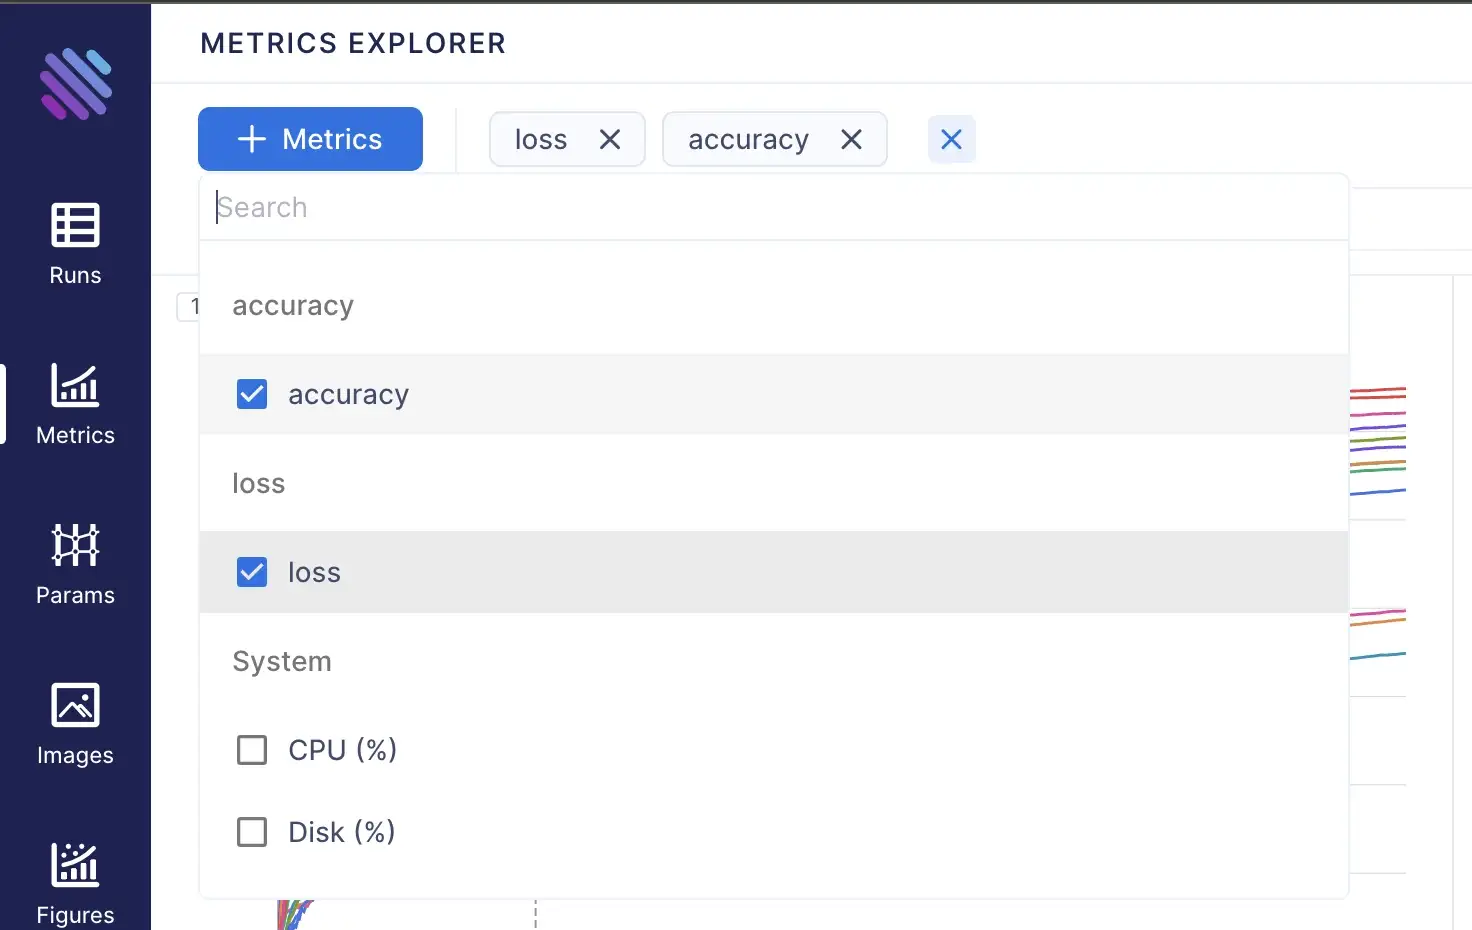
This is the view we will get after selecting to show the loss and accuracy:
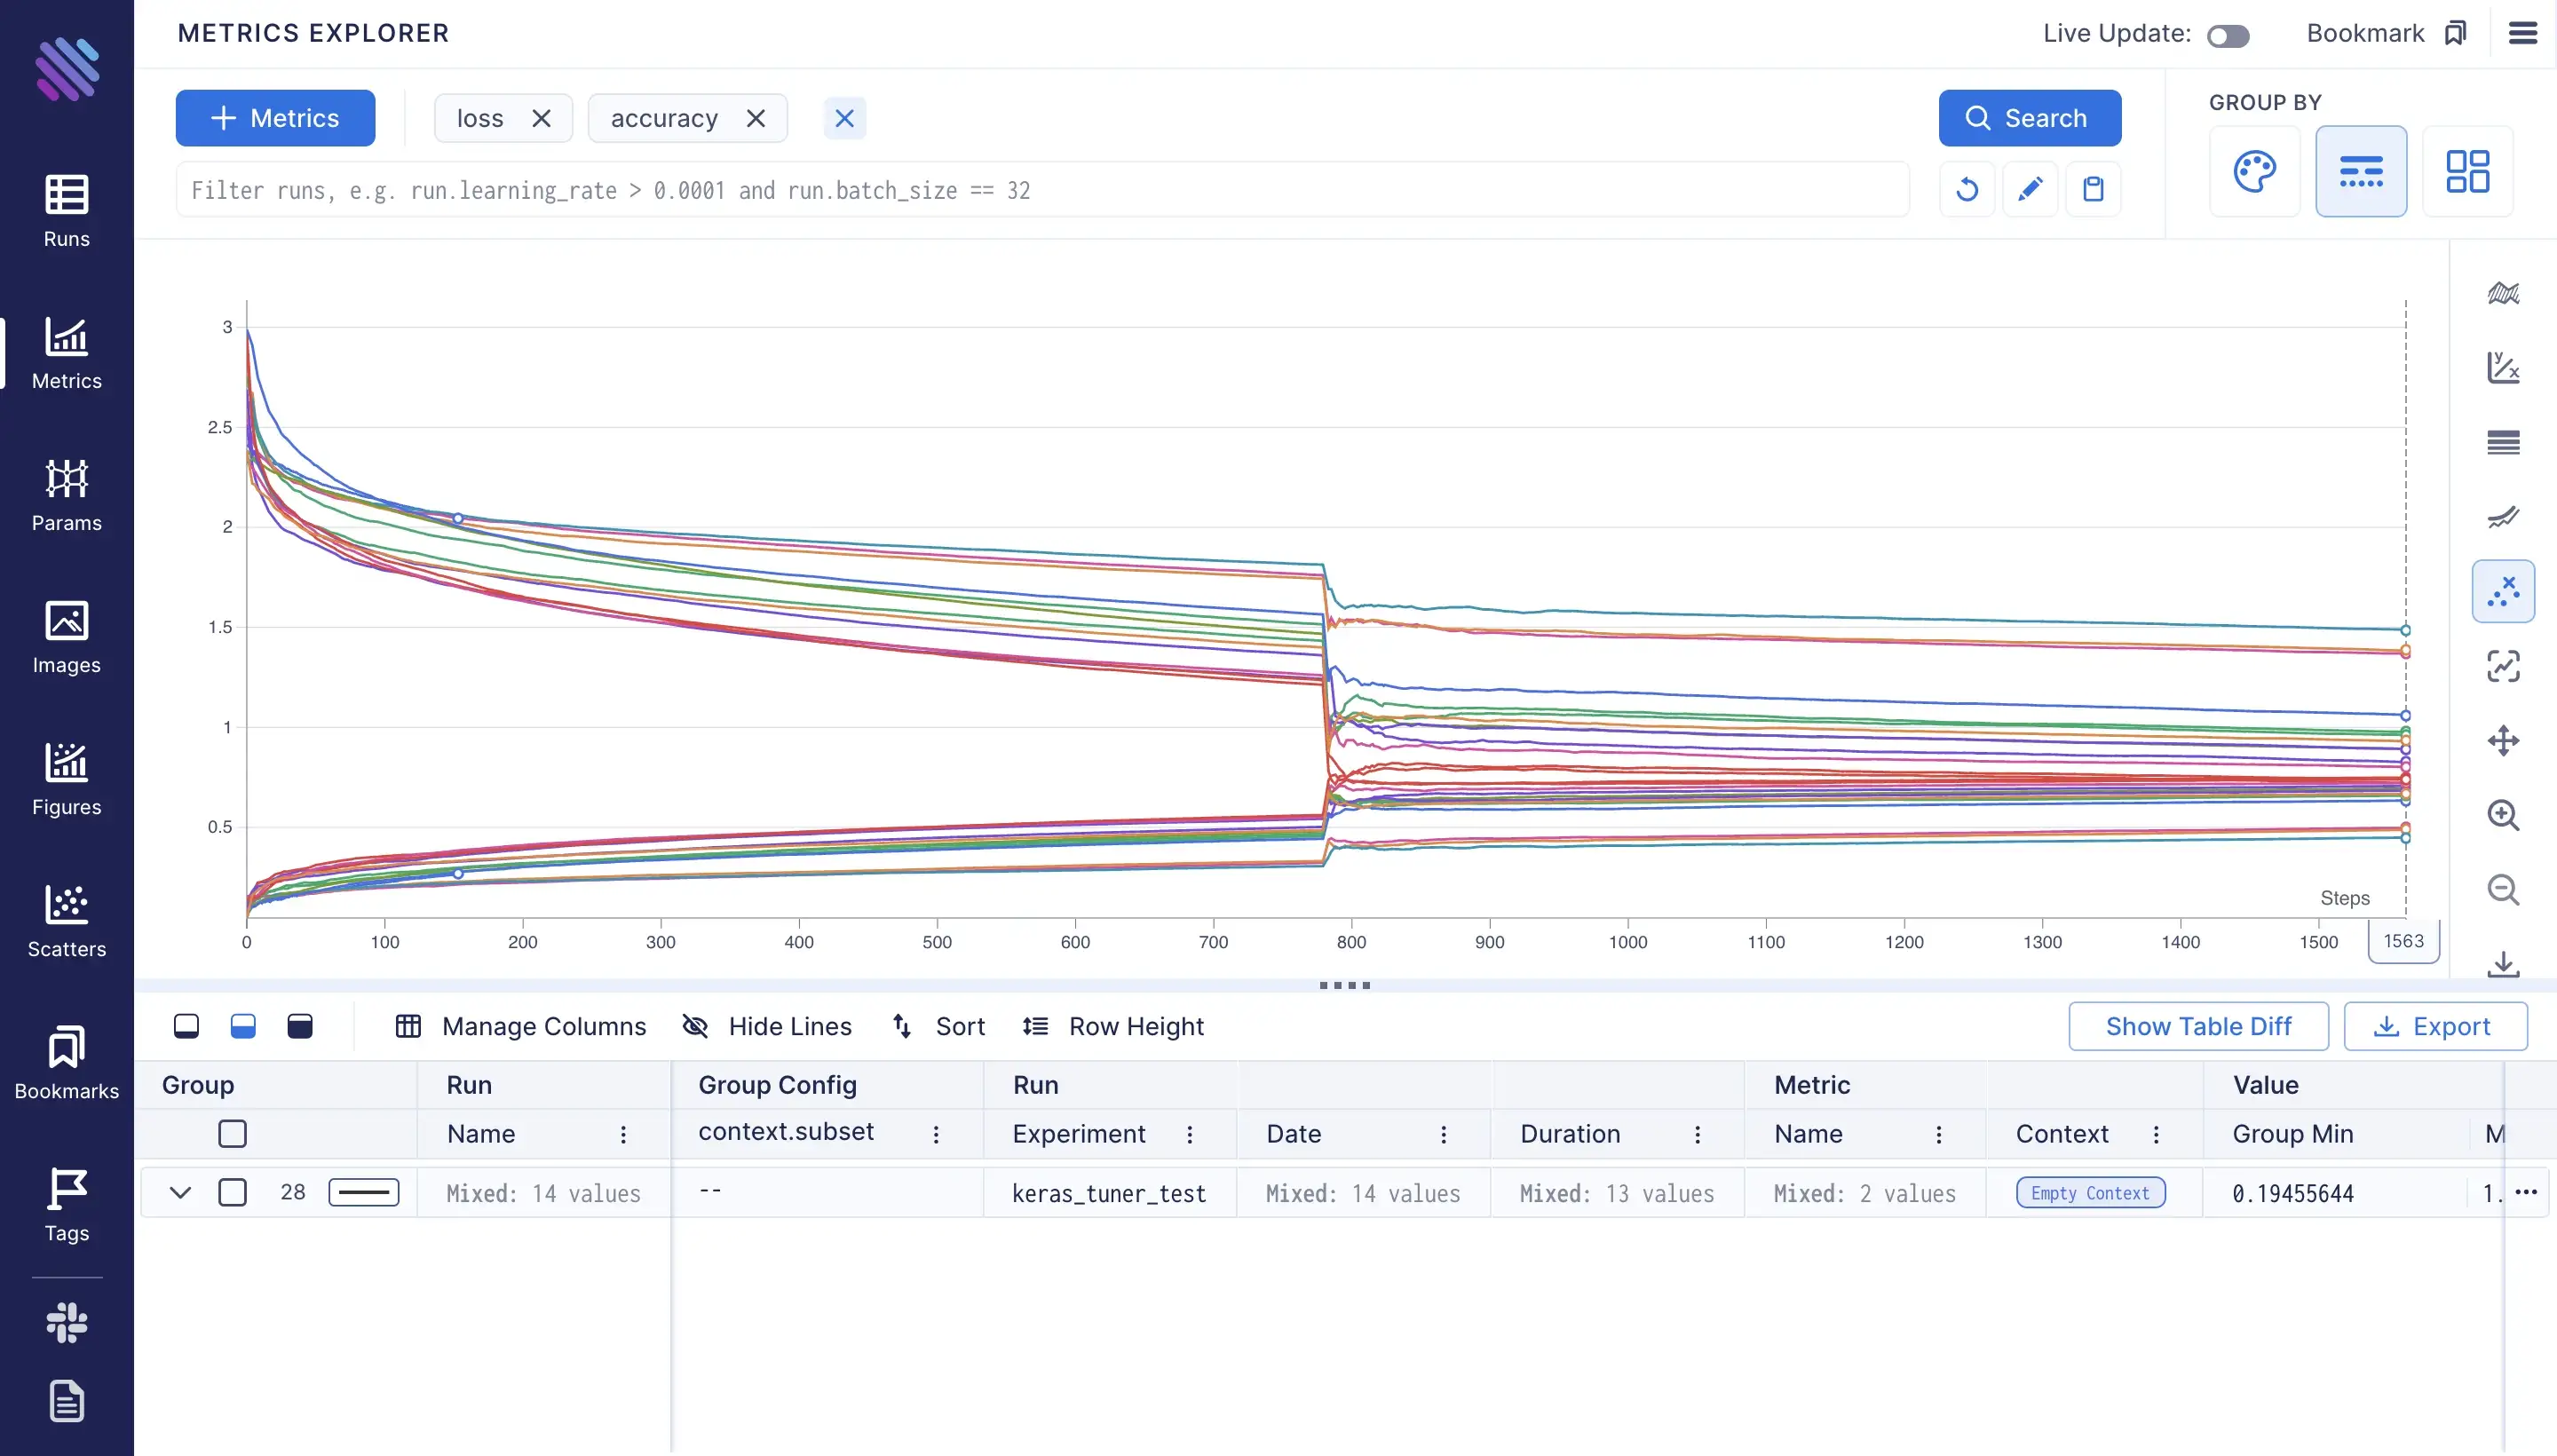
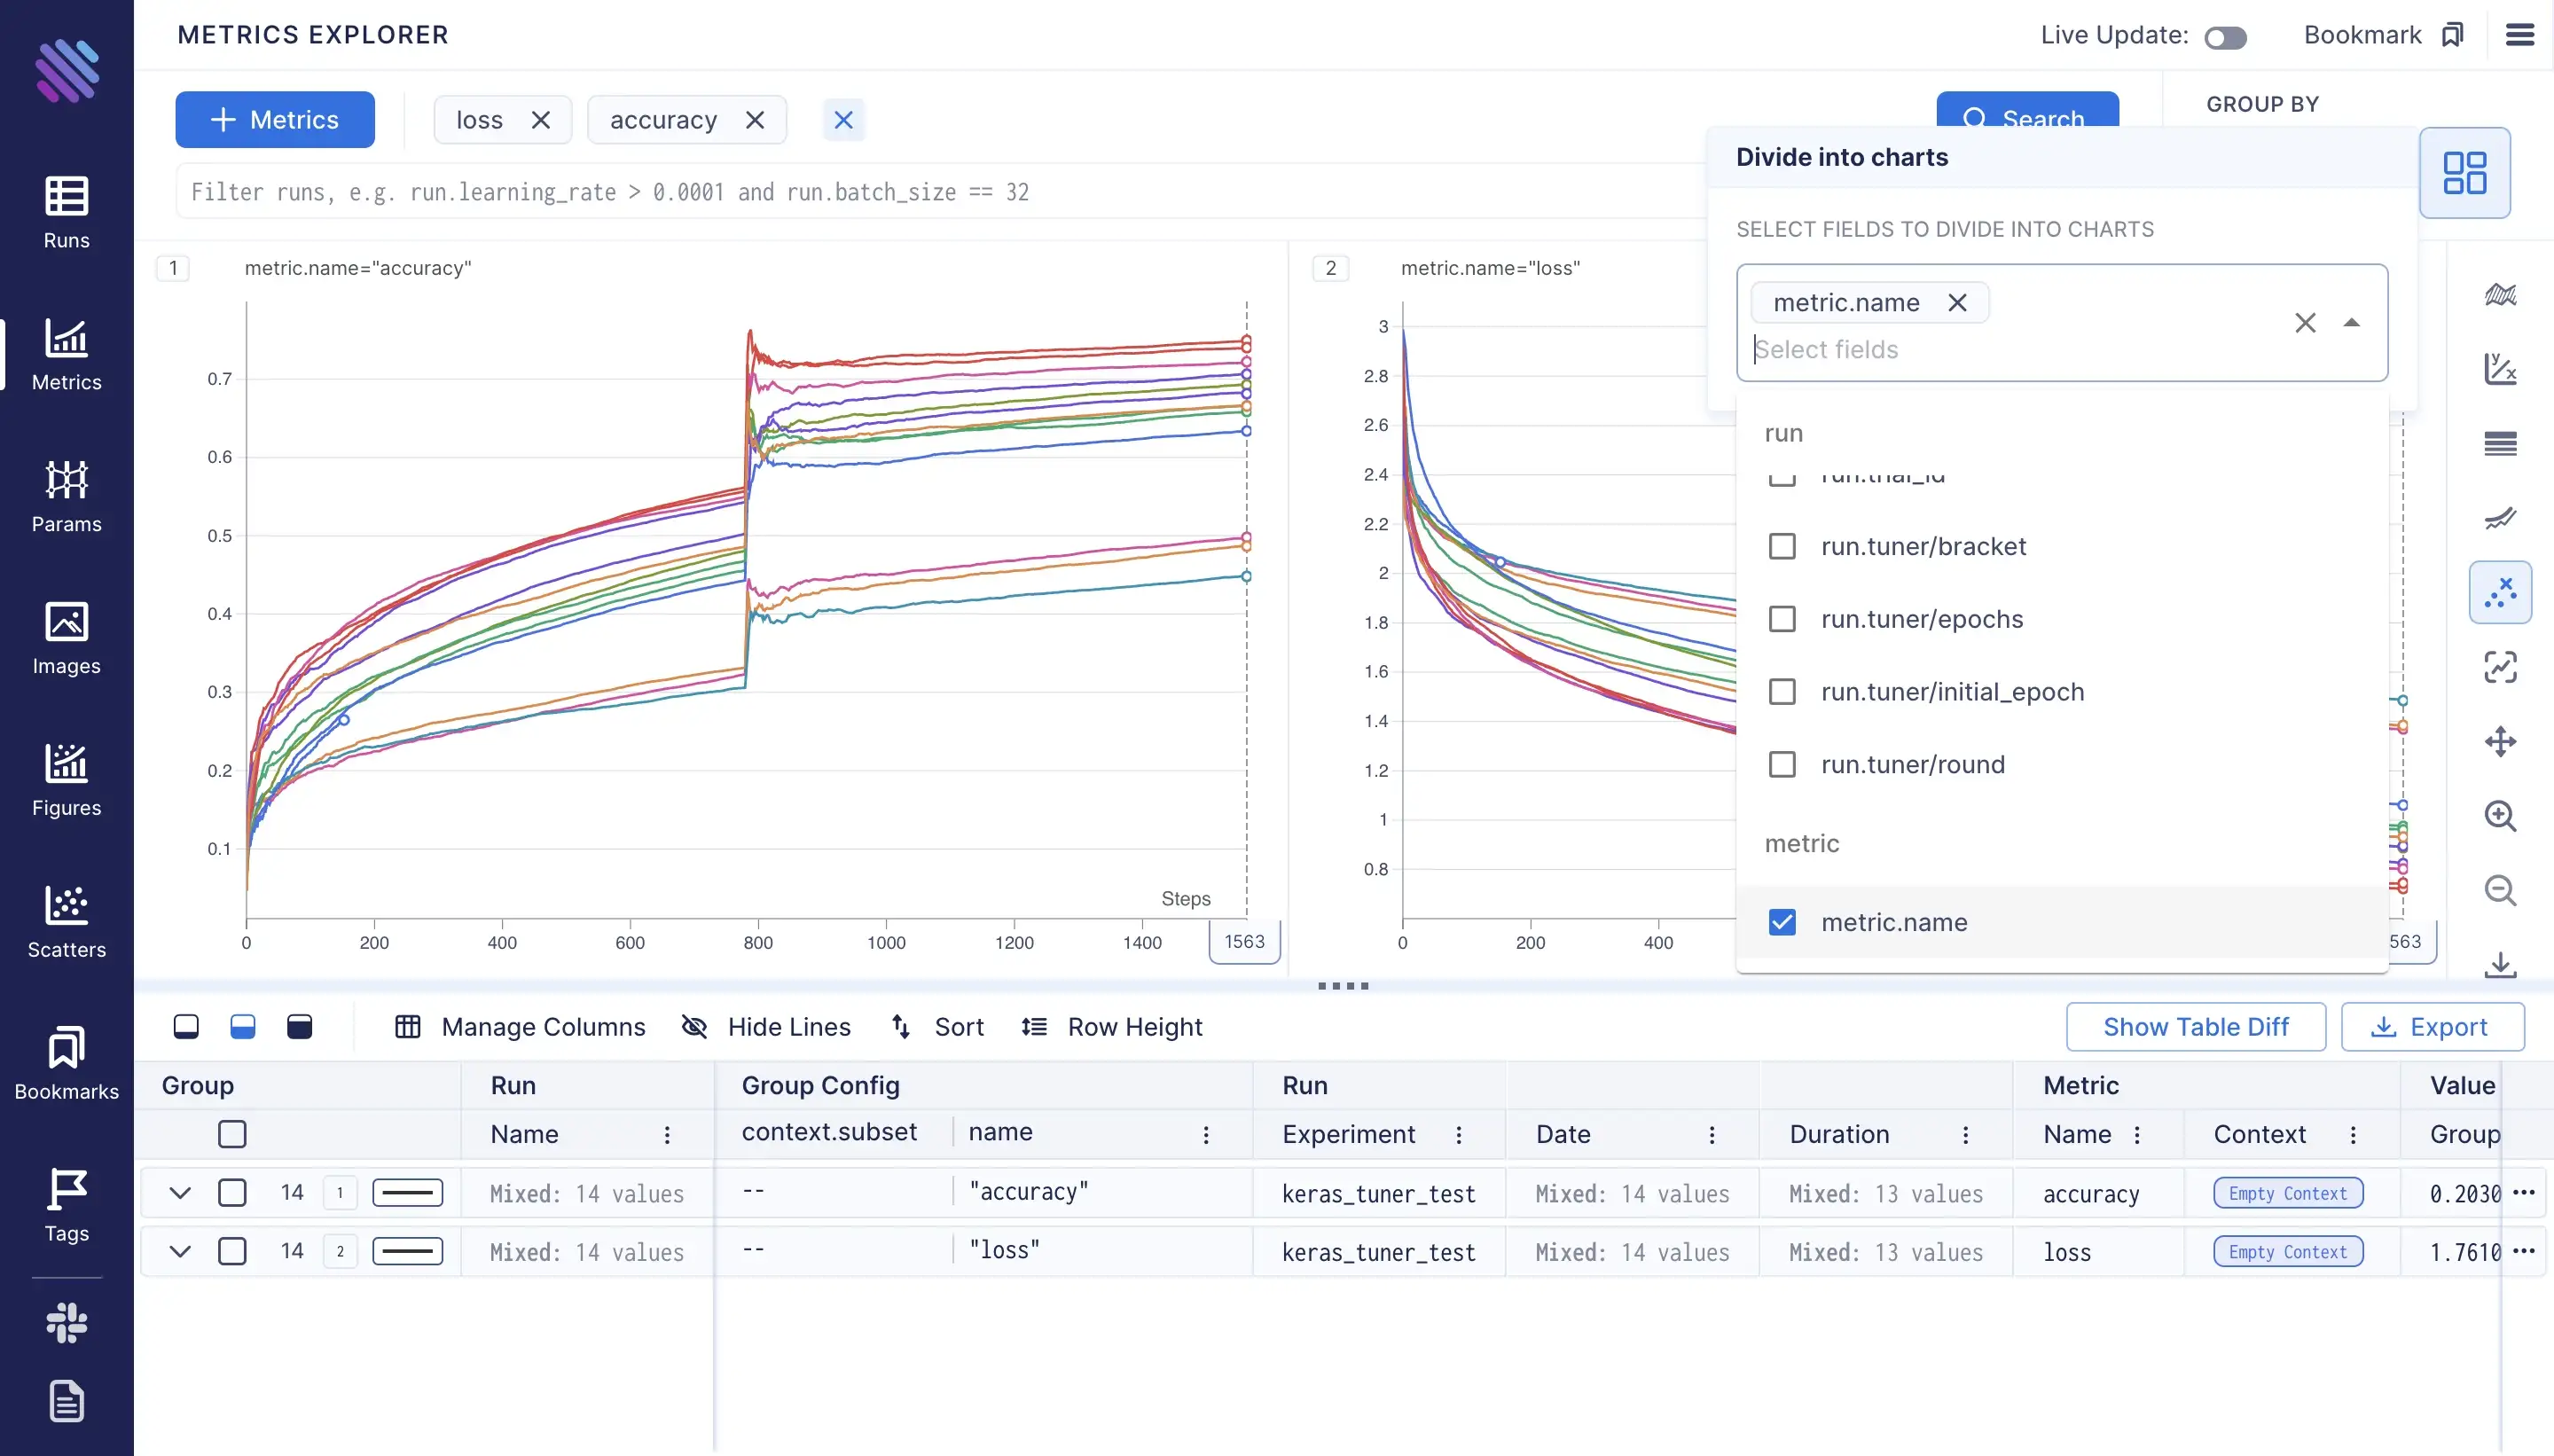
Now as mentioned before aim groups metrics by default, to split them we need to select some criterions. Say we wan’t to see the plots by metric name, so each plot will represent a metric’s values.
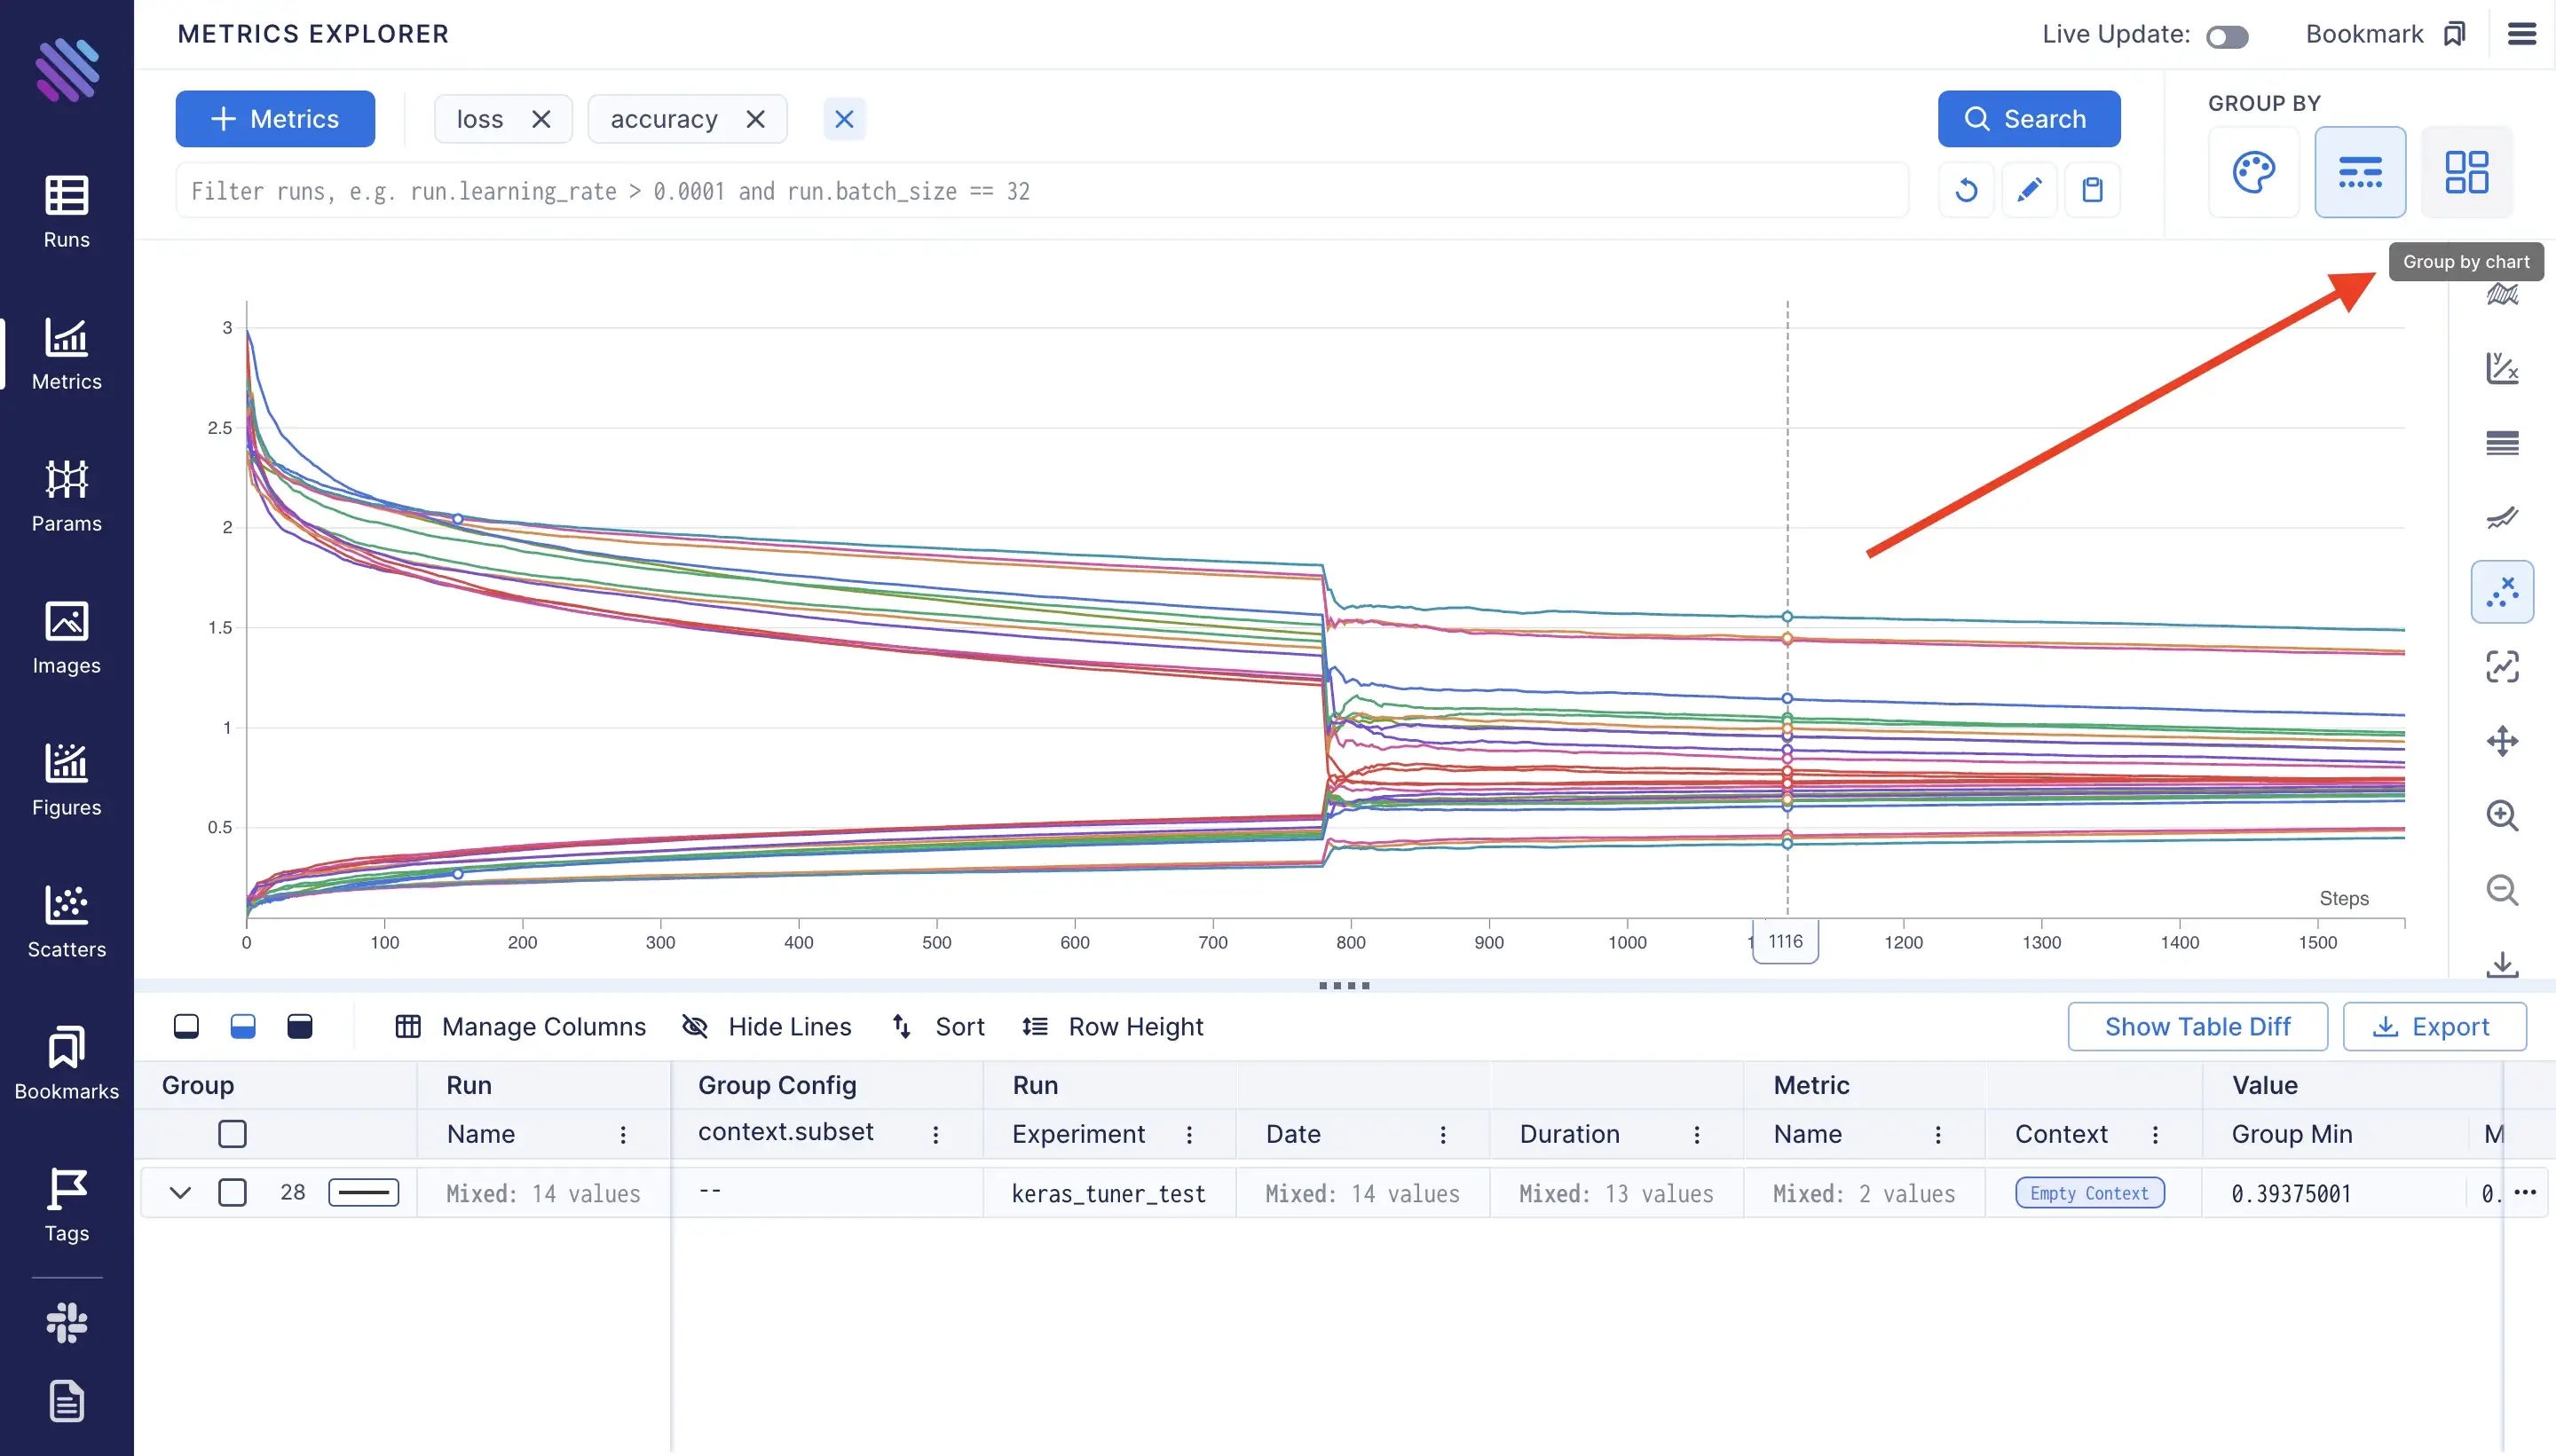
We simply need to access the metric.name .
To have unique coloring for each run, we can use the “Group by color” functionality, and provide the run.hash. Aim assigns a unique hash to each run.
Note: in this example the Aim UI automatically assigns individual colors for each run.
Note: in this example the Aim UI automatically assigns individual colors for each run.)
\ To select runs with non-trivial comparisons we can use a custom query instead of just adding the metrics. To enable the “advanced search mode” click on the pen button under the search button:
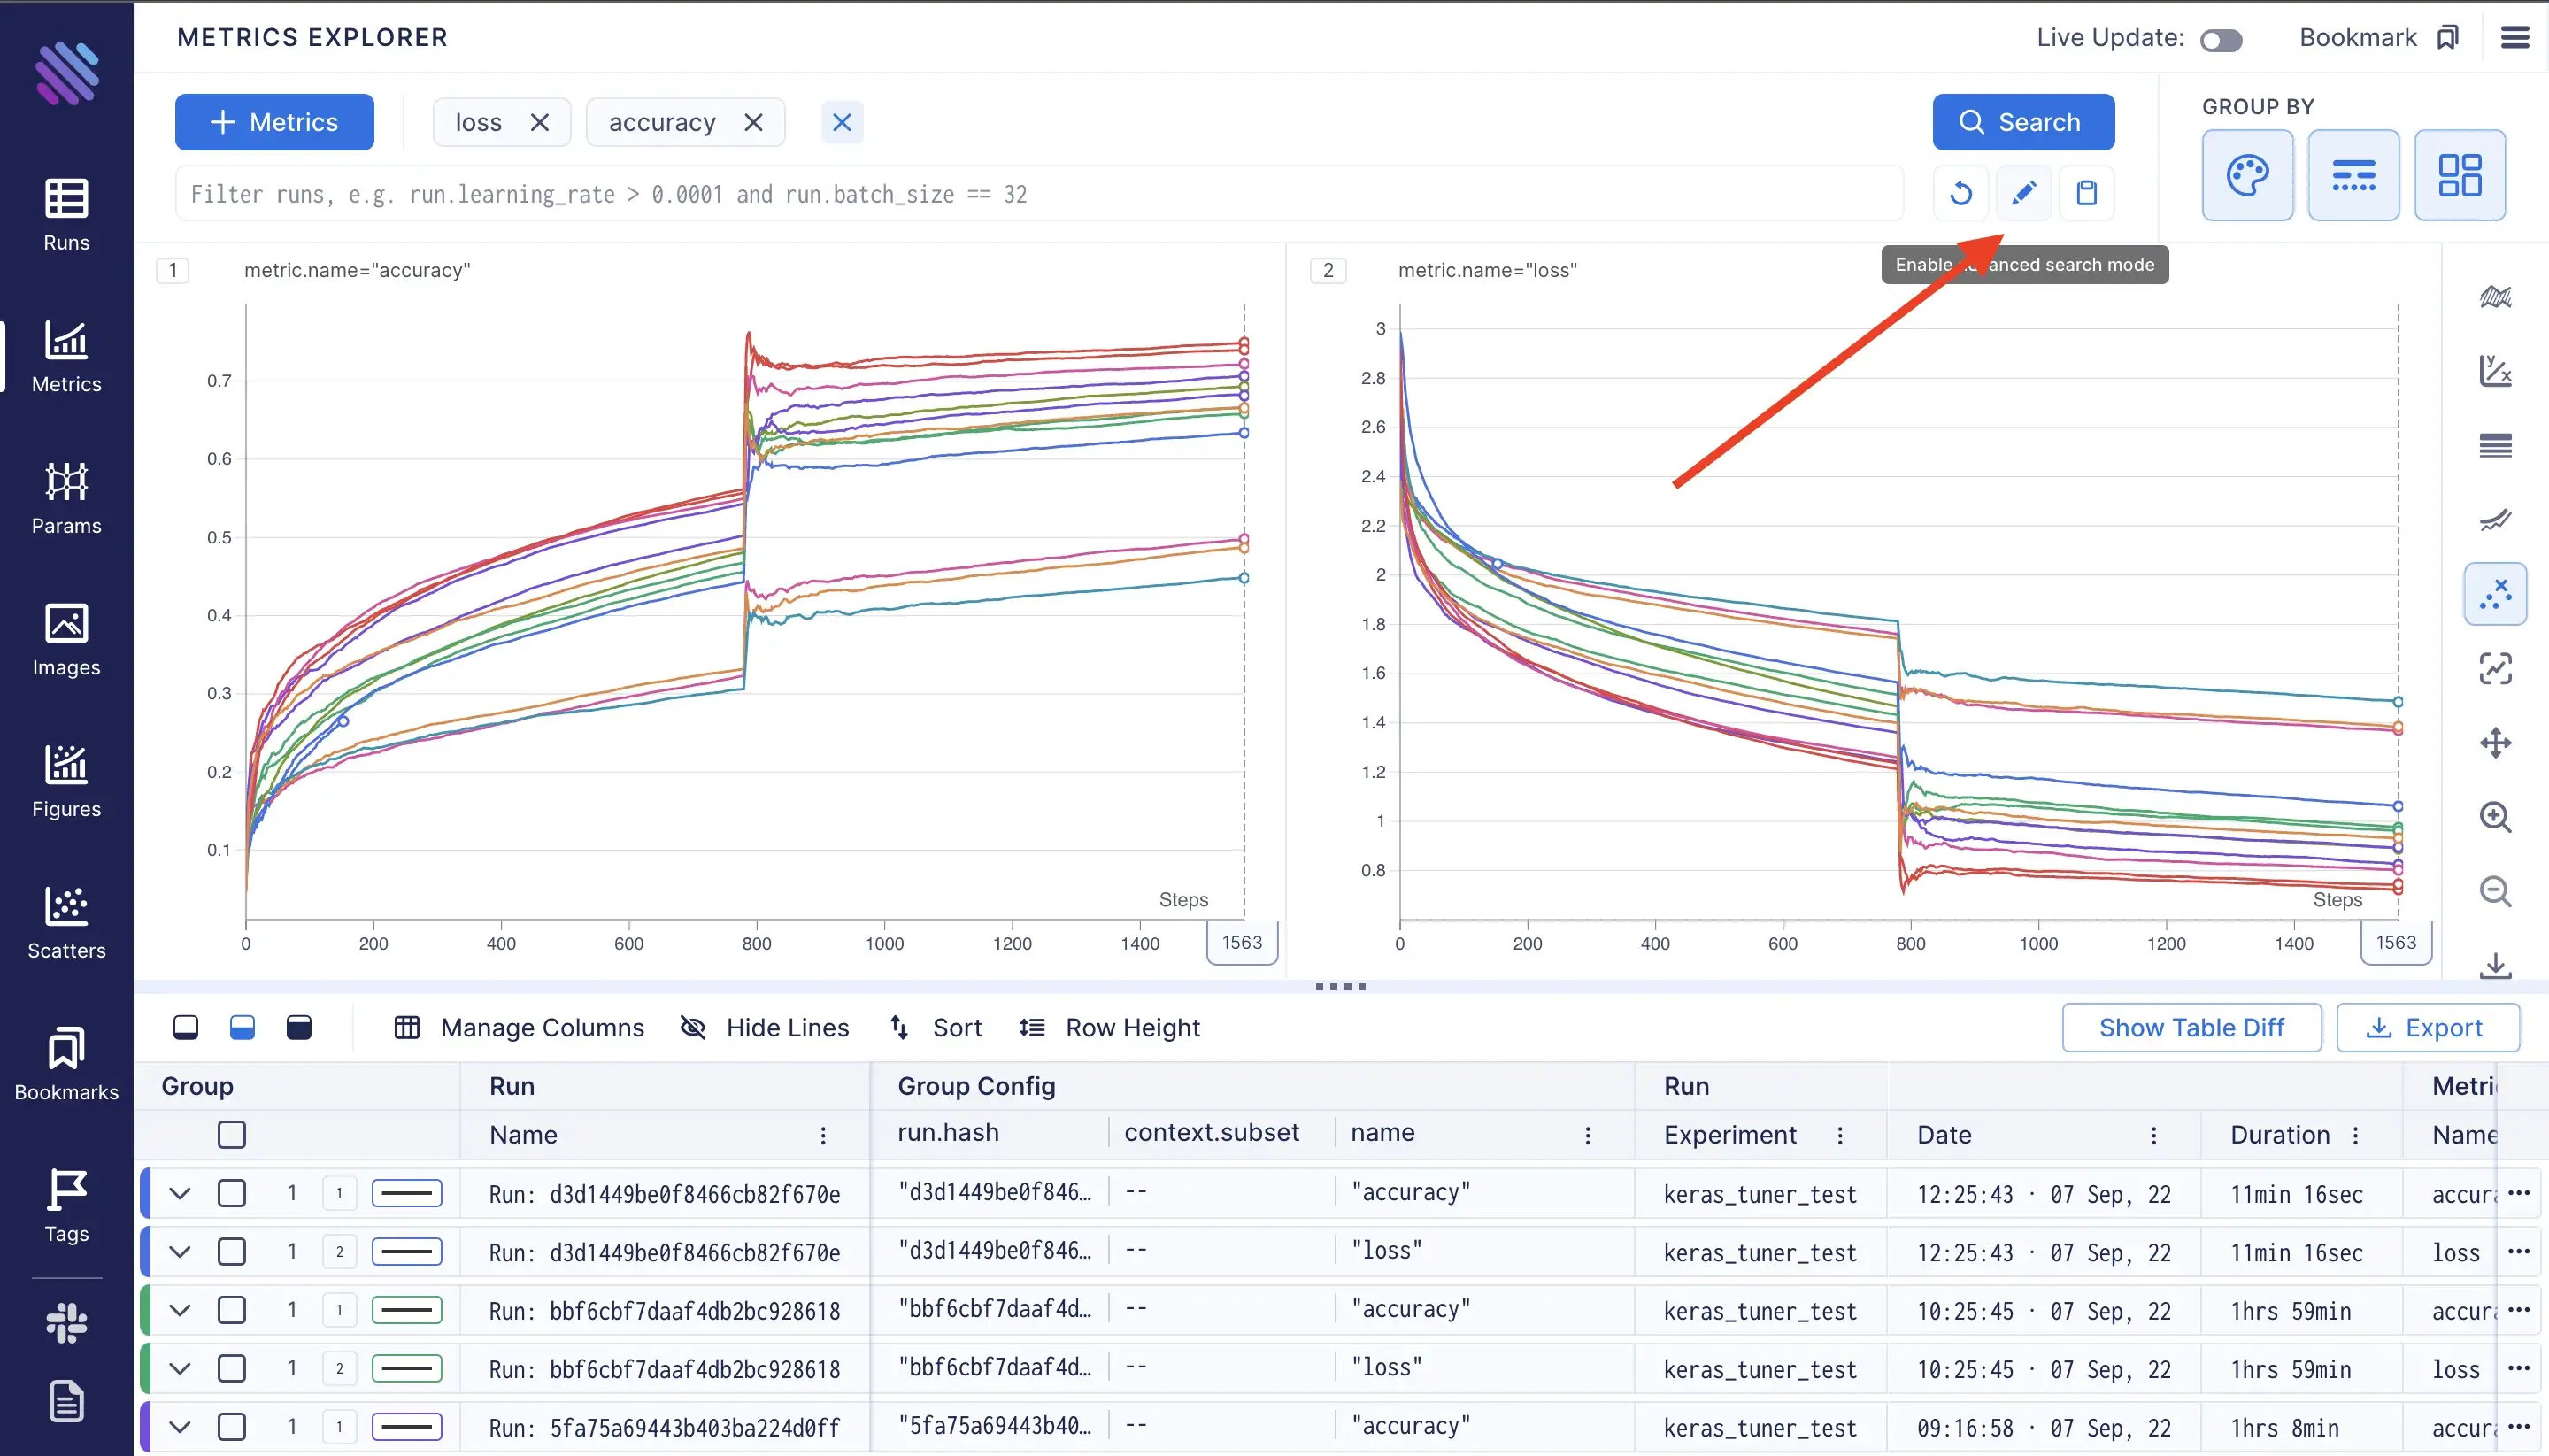
this operation will automatically convert the selections into the form of a query. In our case the query should look like this:
((metric.name == "accuracy") or (metric.name == "loss"))The syntax of Aim query is Pythonic: we can access the properties of objects by dot operation make comparisons and even more. Meanwhile on wandb the operations are limited. For example we can transform our current query into more compact format by just doing:
metric.name in ["accuracy", "loss"]For more please see the “Search Runs” page on docs.
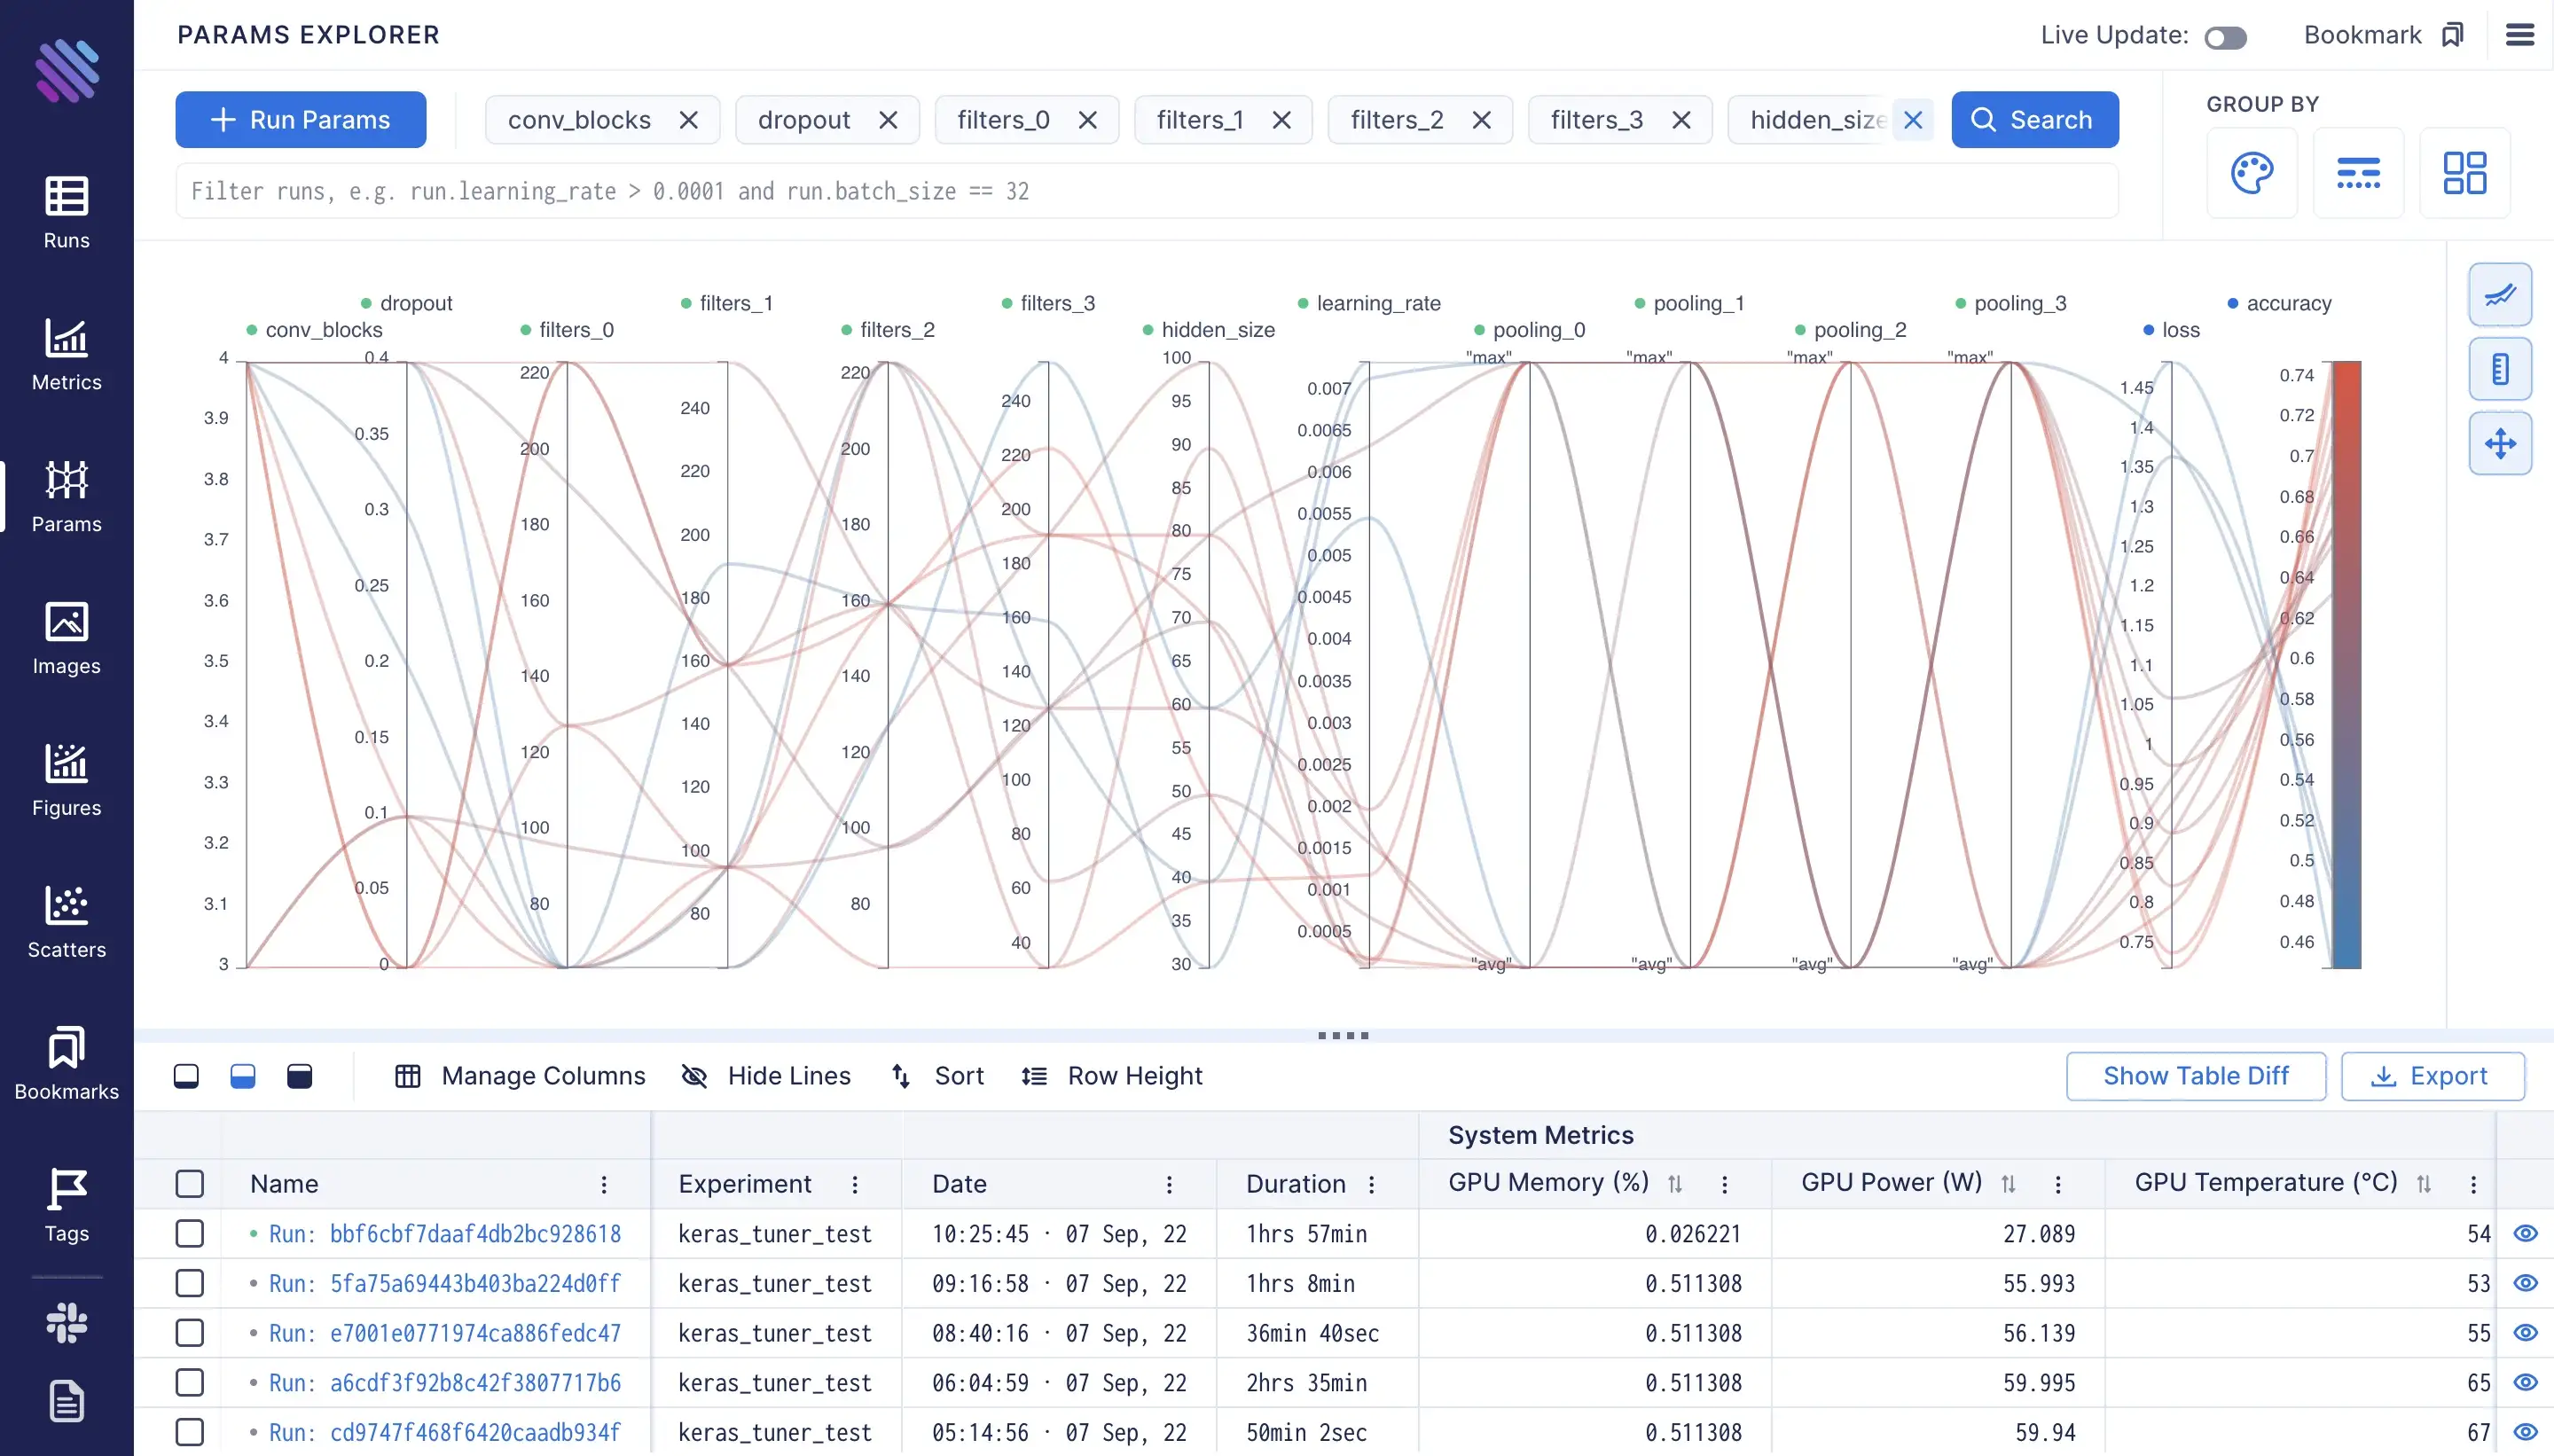
Hyperparameter Explorer
To explore the hyperparameters and their importance on wandb we need to create a new panel. To do that we need to click on the “Add Panel” button, and add the parameters and the metrics we need, e.g.:
Aim counterpart parameters explorer is on the page of “Params”. Where by using the “+ Run Params” button we can add the parameters and the metrics we need to compare. It works super fast, feel free to add as many parameters as you want! :)
Plot Operations
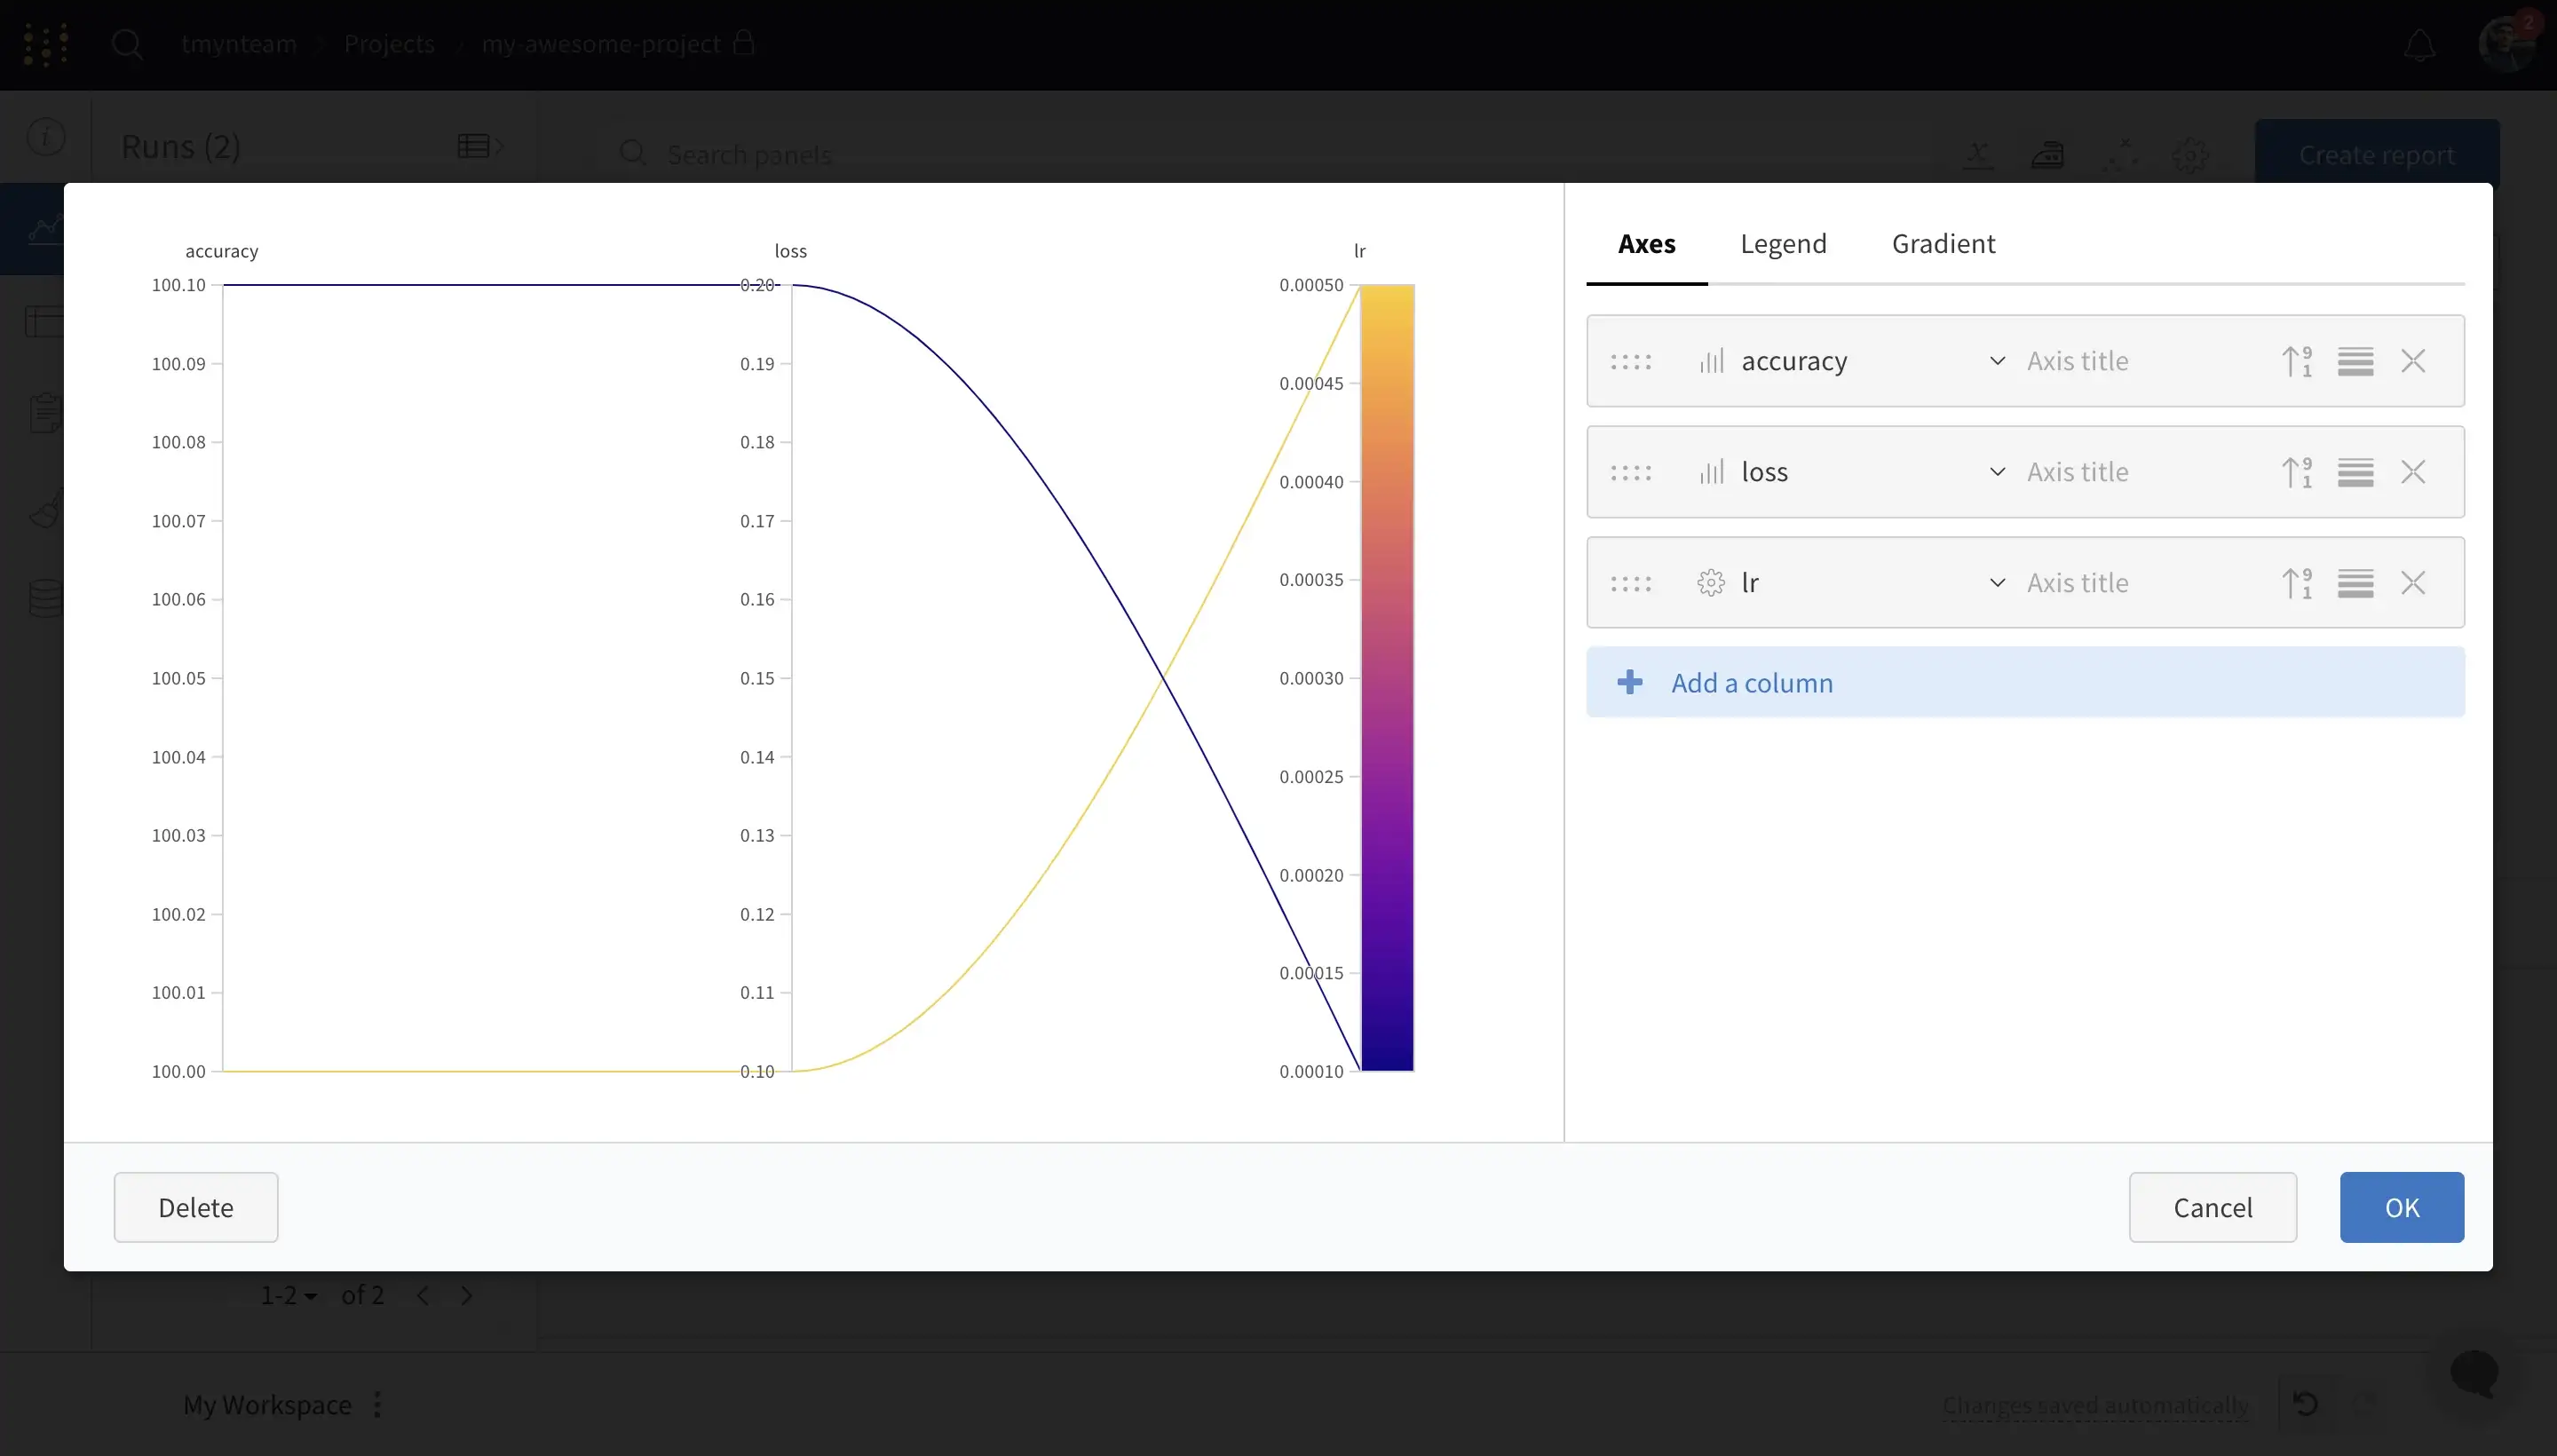
The operations with plots such as scale change, ignoring outliers, smoothing and more are one of the necessary things to make the graphs more ‘readable’ and explicit. On wandb one needs to click on “Edit panel” sign to see this view:
\ On Aim you can find the operations on the right sidebar of the Metrics page:

Conclusion
As much as both of the experiment tracking tools might look similar, they both have individual goals and functionalities. In this simple guid I’ve tried to help a user to transition from wandb to aim or use both. We drawn parallels between their UIs major functionalities. For more please read the docs.
Aim is an open-source rapidly growing experiment tracking tool, new features are added periodically and the existing ones are made even faster and better. The maintainers are open to contributions and are super helpful along with the overall community.