We are excited to announce the release of aimlflow, an integration that helps to seamlessly run a powerful experiment tracking UI on MLflow logs! 🎉
MLflow is an open source platform for managing the ML lifecycle, including experimentation, reproducibility, deployment, and a central model registry. While MLflow provides a great foundation for managing machine learning projects, it can be challenging to effectively explore and understand the results of tracked experiments. Aim is a tool that addresses this challenge by providing a variety of features for deeply exploring and learning tracked experiments insights and understanding results via UI.
With aimlflow, MLflow users can now seamlessly view and explore their MLflow experiments using Aim’s powerful features, leading to deeper understanding and more effective decision-making.

In this article, we will guide you through the process of running a several CNN trainings, setting up aimlfow and exploring the results via UI. Let’s dive in and see how to make it happen.
Aim is an easy-to-use open-source experiment tracking tool supercharged with abilities to compare 1000s of runs in a few clicks. Aim enables a beautiful UI to compare and explore them.
View more on GitHub: https://github.com/aimhubio/aim
Project overview
We use a simple project that trains a CNN using PyTorch and Ray Tune on the CIFAR-10 dataset. We will train multiple CNNs by adjusting the learning rate and the number of neurons in two of the network layers using the following stack:
- PyTorch for building and training the model
- Ray Tune for hyper-parameters tuning
- MLflow for experiment tracking
Find the full project code on GitHub: https://github.com/aimhubio/aimlflow/tree/main/examples/hparam-tuning
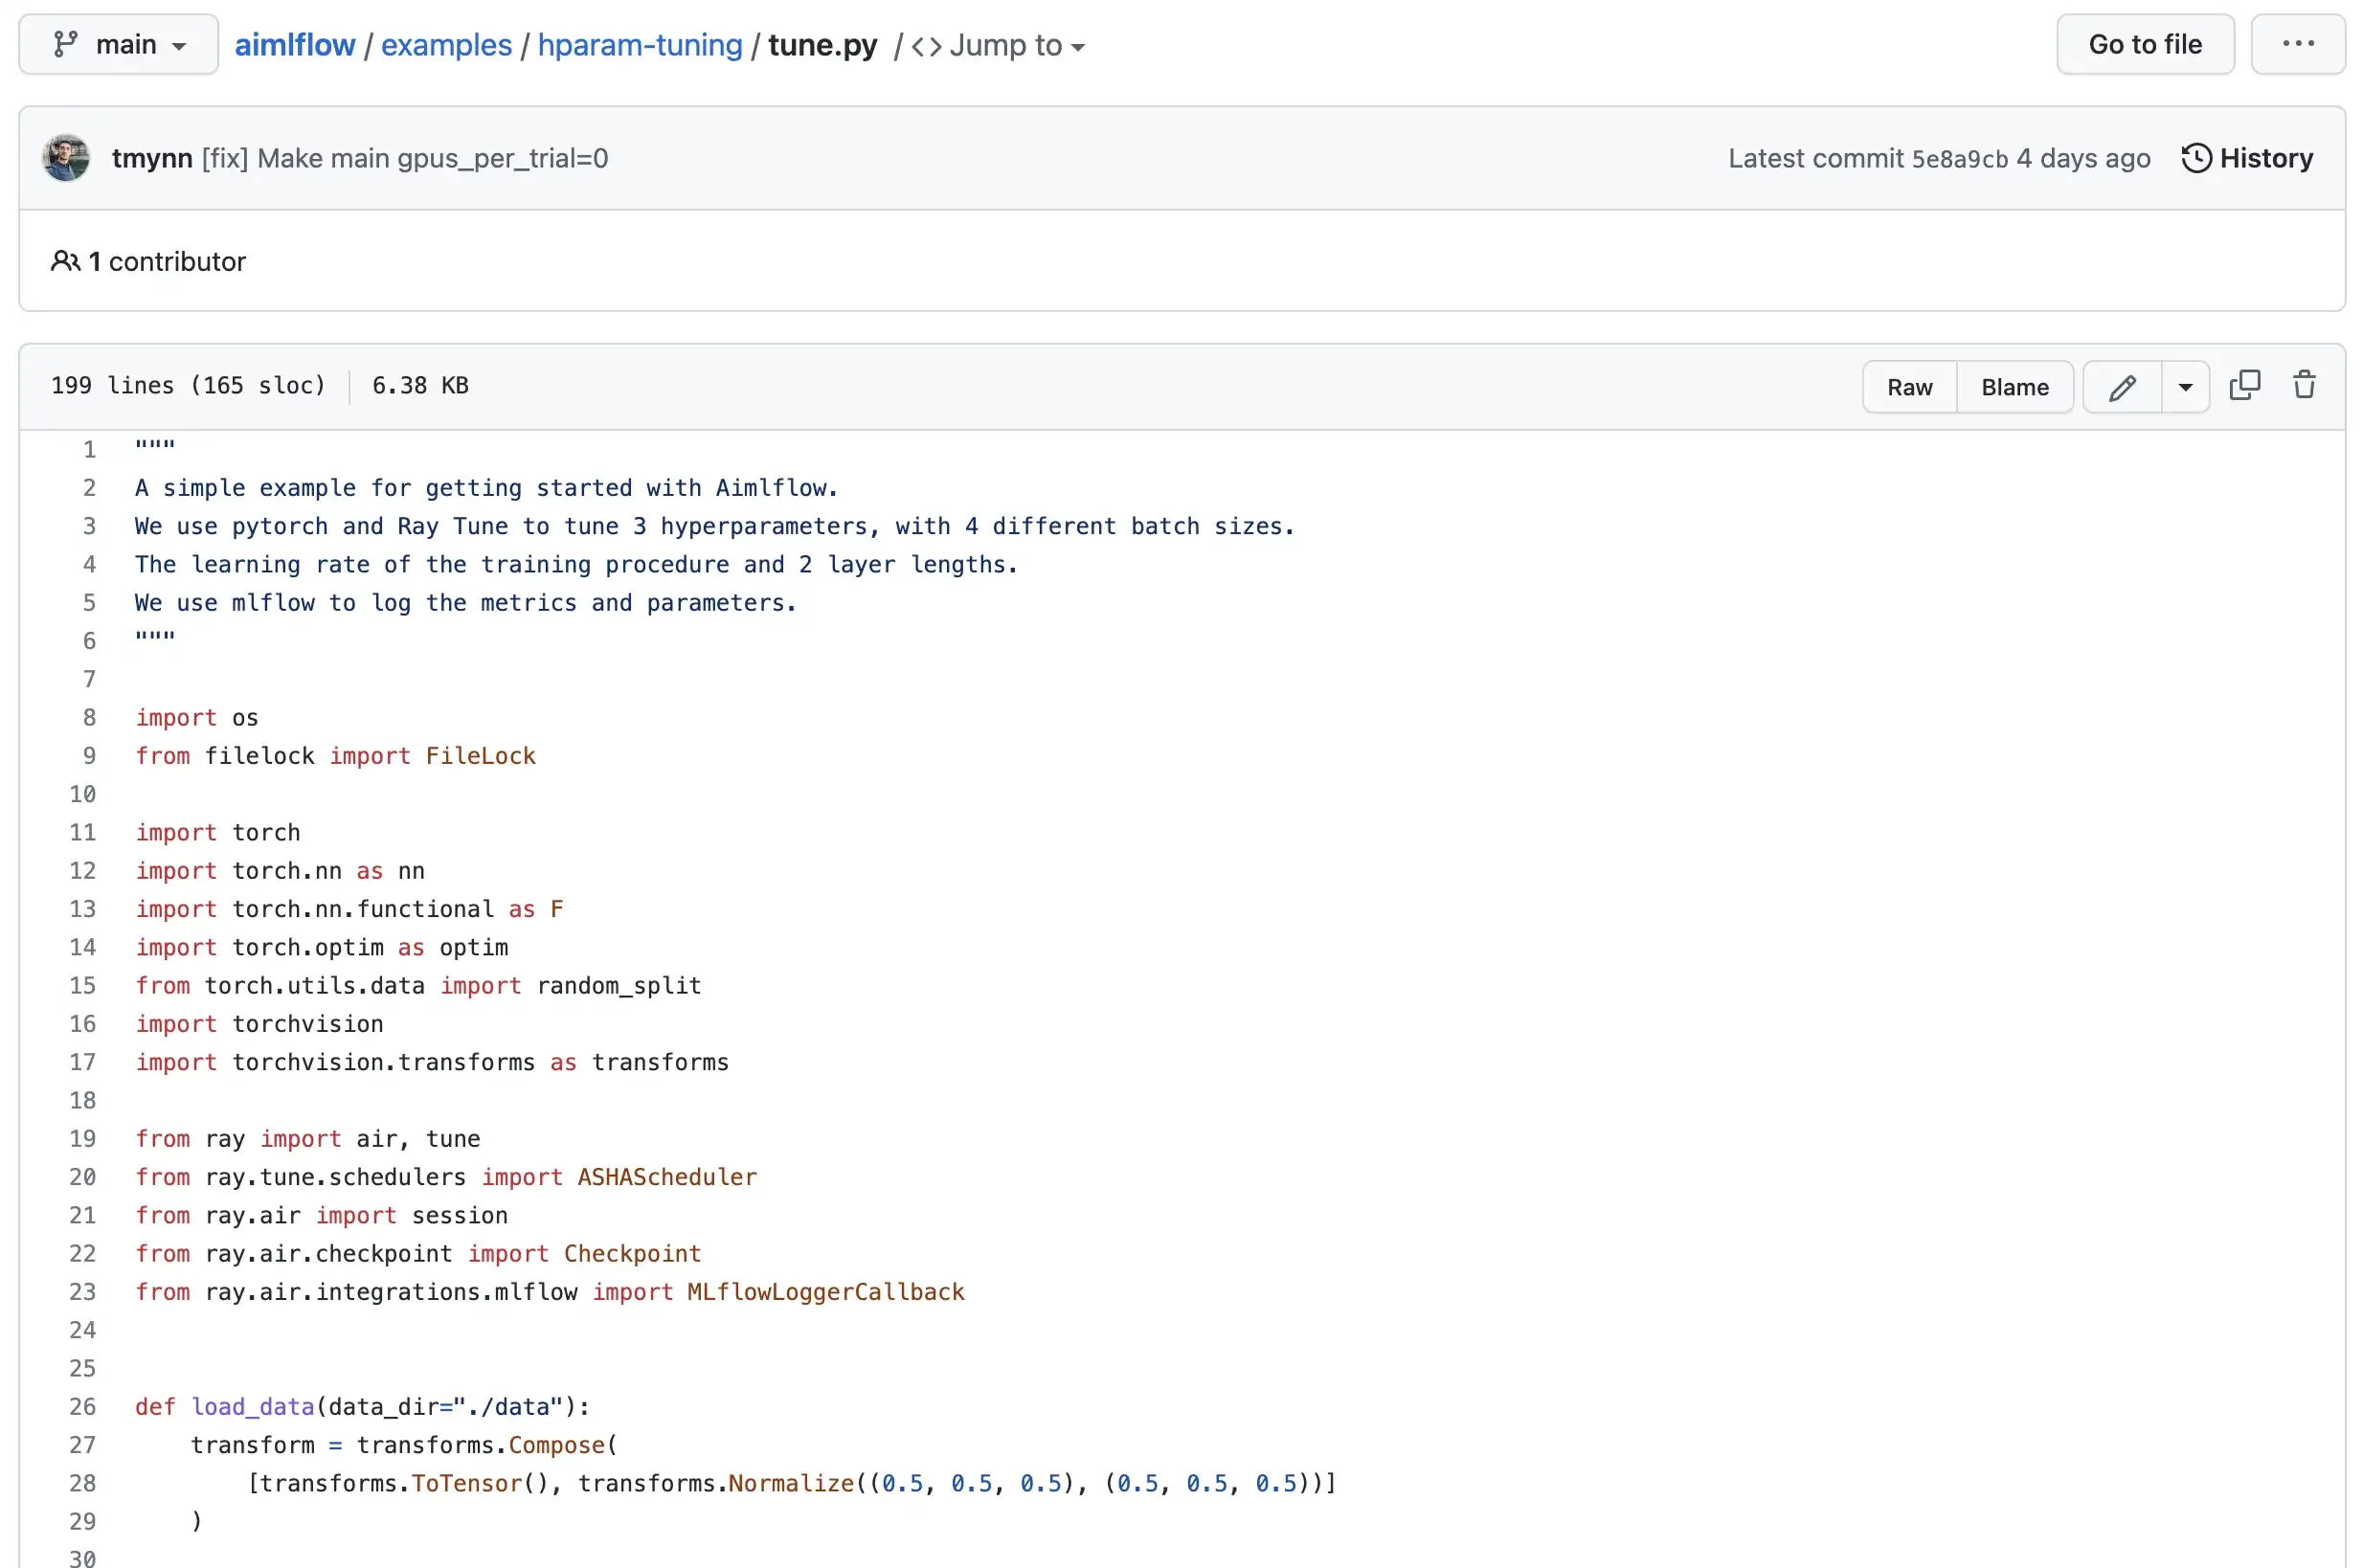
Run the trainings by downloading and executing tune.py python file:
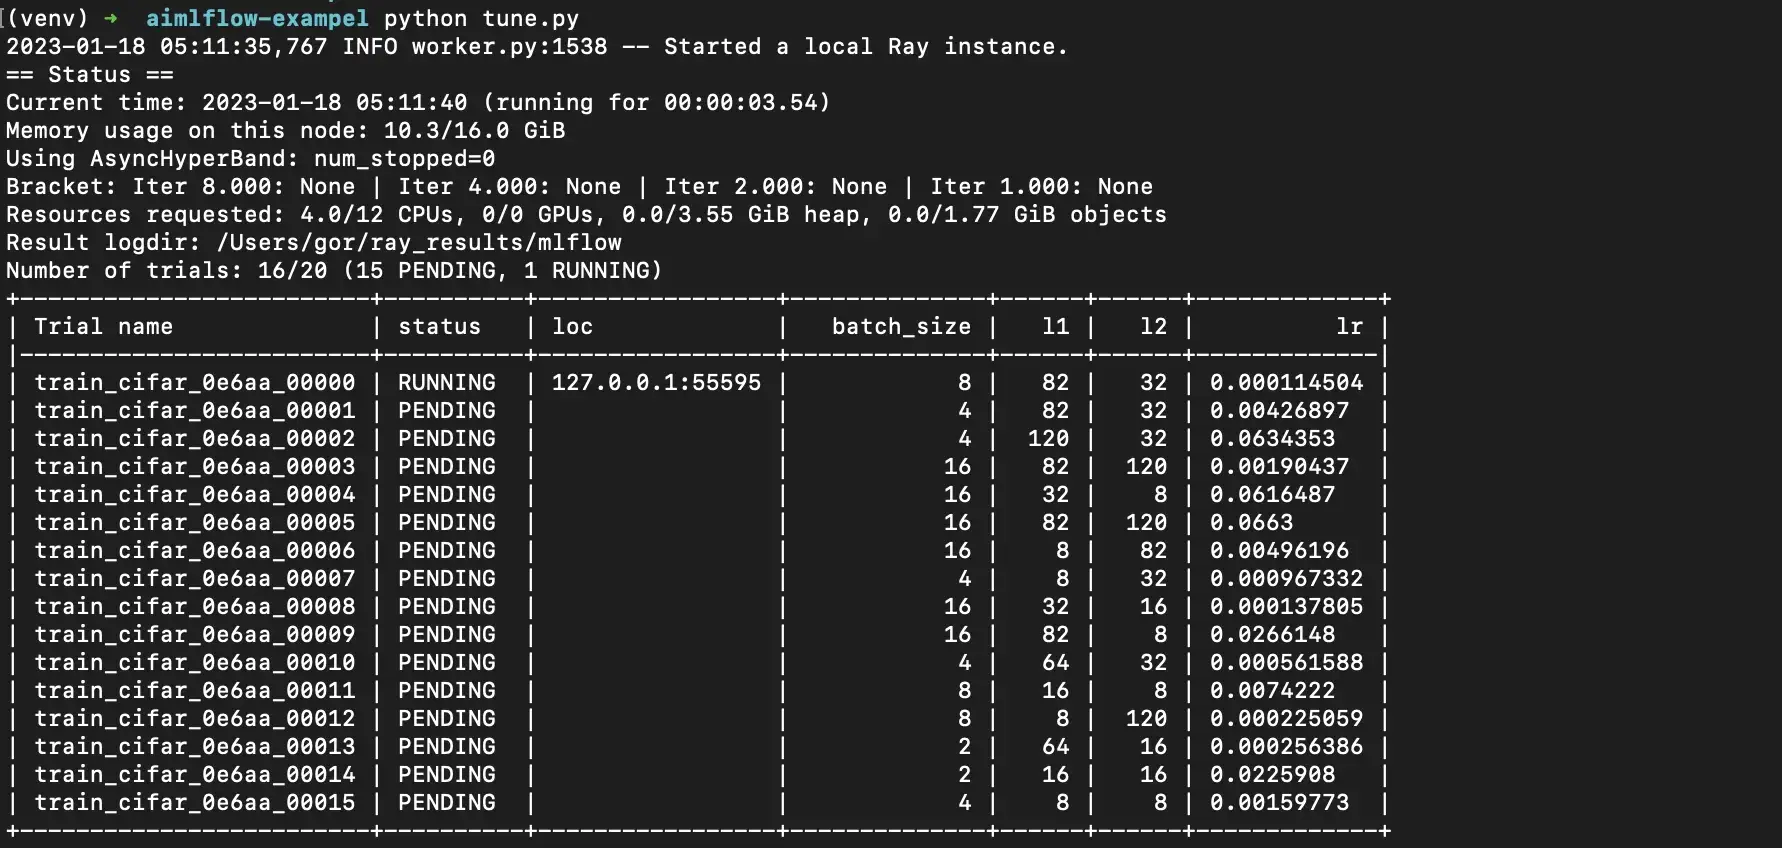
python tune.pyYou should see a similar output, meaning the trainings are successfully initiated:
Getting started with aimlflow
After the hyper-parameter tuning is ran, let’s see how aimlflow can help us to explore the tracked experiments via UI.
To be able to explore MLflow logs with Aim, we will need to convert MLflow experiments to Aim format. All the metrics, tags, config, artifacts, and experiment descriptions will be stored and live-synced in a .aim repo located on the file system.
This means that you can run your training script, and without modifying a single line of code, live-time view the logs on the beautiful UI of Aim. Isn’t it amazing? 🤩
1. Install aimlflow on your machine
It is super easy to install aimlflow, simply run the following command:
pip3 install aim-mlflow2. Sync MLflow logs with Aim
Pick any directory on your file system and initialize a .aim repo:
aim initRun the aimlflow sync command to sync MLflow experiments with the Aim repo:
aimlflow sync --mlflow-tracking-uri=MLFLOW_URI --aim-repo=AIM_REPO_PATH3. Run Aim
Now that we have synced MLflow logs and we have some trainings logged, all we need to do is to run Aim:
aim up --repo=AIM_REPO_PATHYou will see the following message on the terminal output:
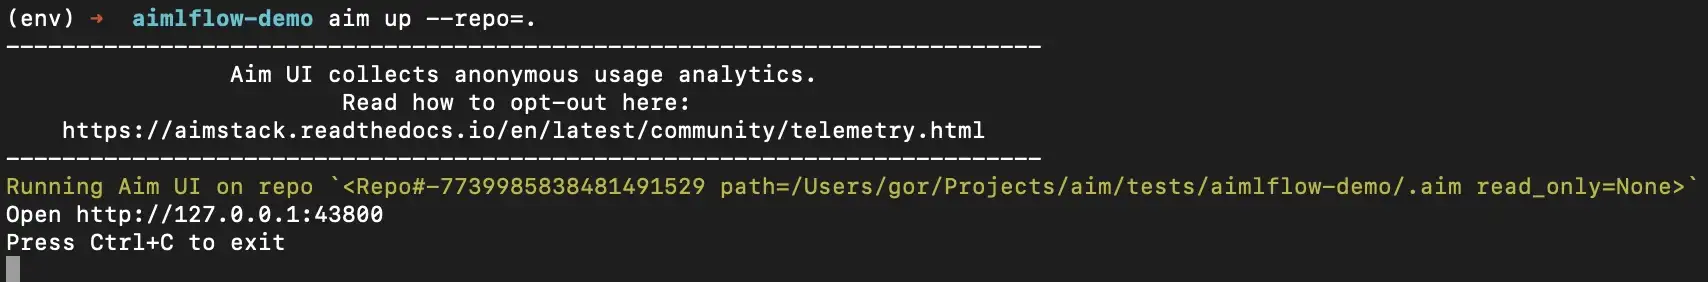
Congratulations! Now you can explore the training logs with Aim. 🎉
Quick tour of Aim for MLflow users
In this section, we will take a quick tour of Aim’s features, including:
- Exploring hyper-parameters tuning results
- Comparing tracked metrics
- As well as, taking a look at the other capabilities Aim provides
Exploring MLflow experiments
Now then Aim is set up and running, we navigate to the project overview page at 127.0.0.1:43800, where the summary of the project is displayed:
- The number of tracked training runs and experiments
- Statistics on the amount of tracked metadata
- A list of experiments and tags, with the ability to quickly explore selected items
- A calendar and feed of contributions
- A table of in-progress trainings

\
To view the results of the trainings, let’s navigate to the runs dashboard at 127.0.0.1:43800/runs. Here, you can see hyper-parameters and metrics results all of the trainings.

We can deeply explore the results and tracked metadata for a specific run by clicking on its name on the dashboard.

On this page, we can view the tracked hparams, including the mlflow_run_id and the mlflow_run_name which are extracted from MLflow runs during the conversion process. Additionally, detailed information about the run can be found on each of the tabs, such as tracked hparams, metrics, notes, output logs, system resource usage, etc.
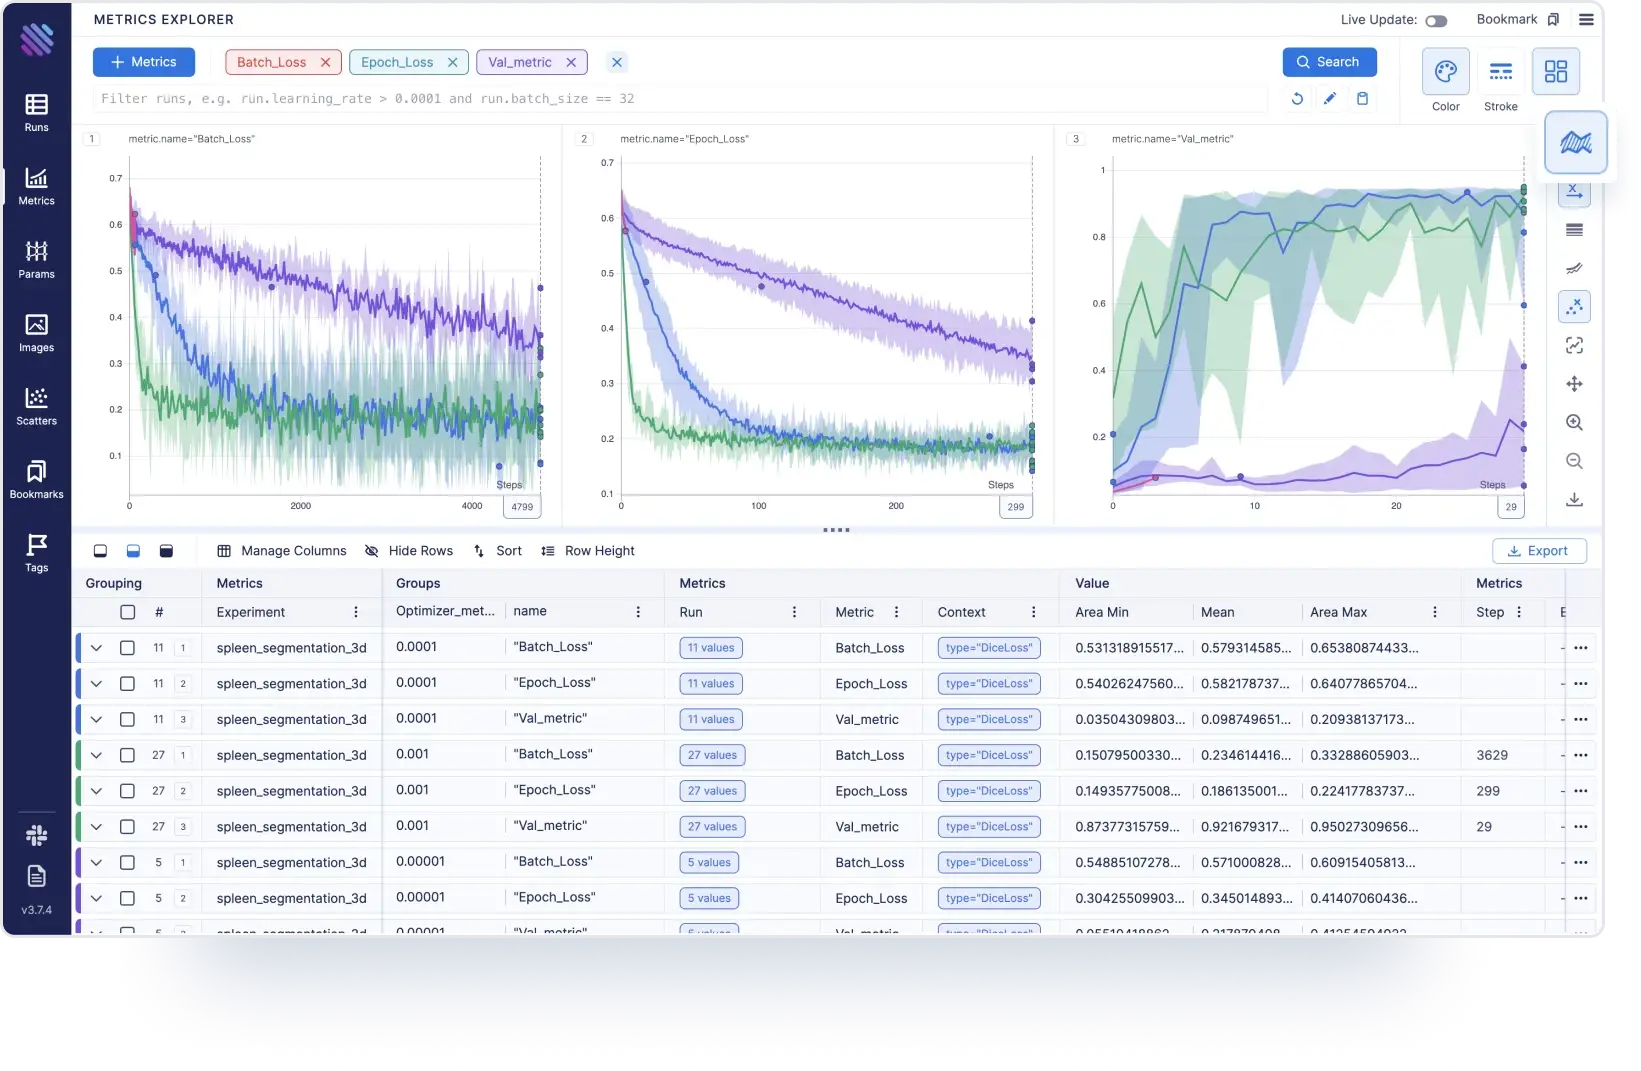
Comparing metrics
Comparing metrics across several runs is super easy with Aim:
- Open the metrics page from the left sidebar
- Select desired metrics by clicking on
+ Metricsbutton - Pressing
Searchbutton on the top right corner
We will select losses and accuracies to compare them over all the trials. The following view of metrics will appear:
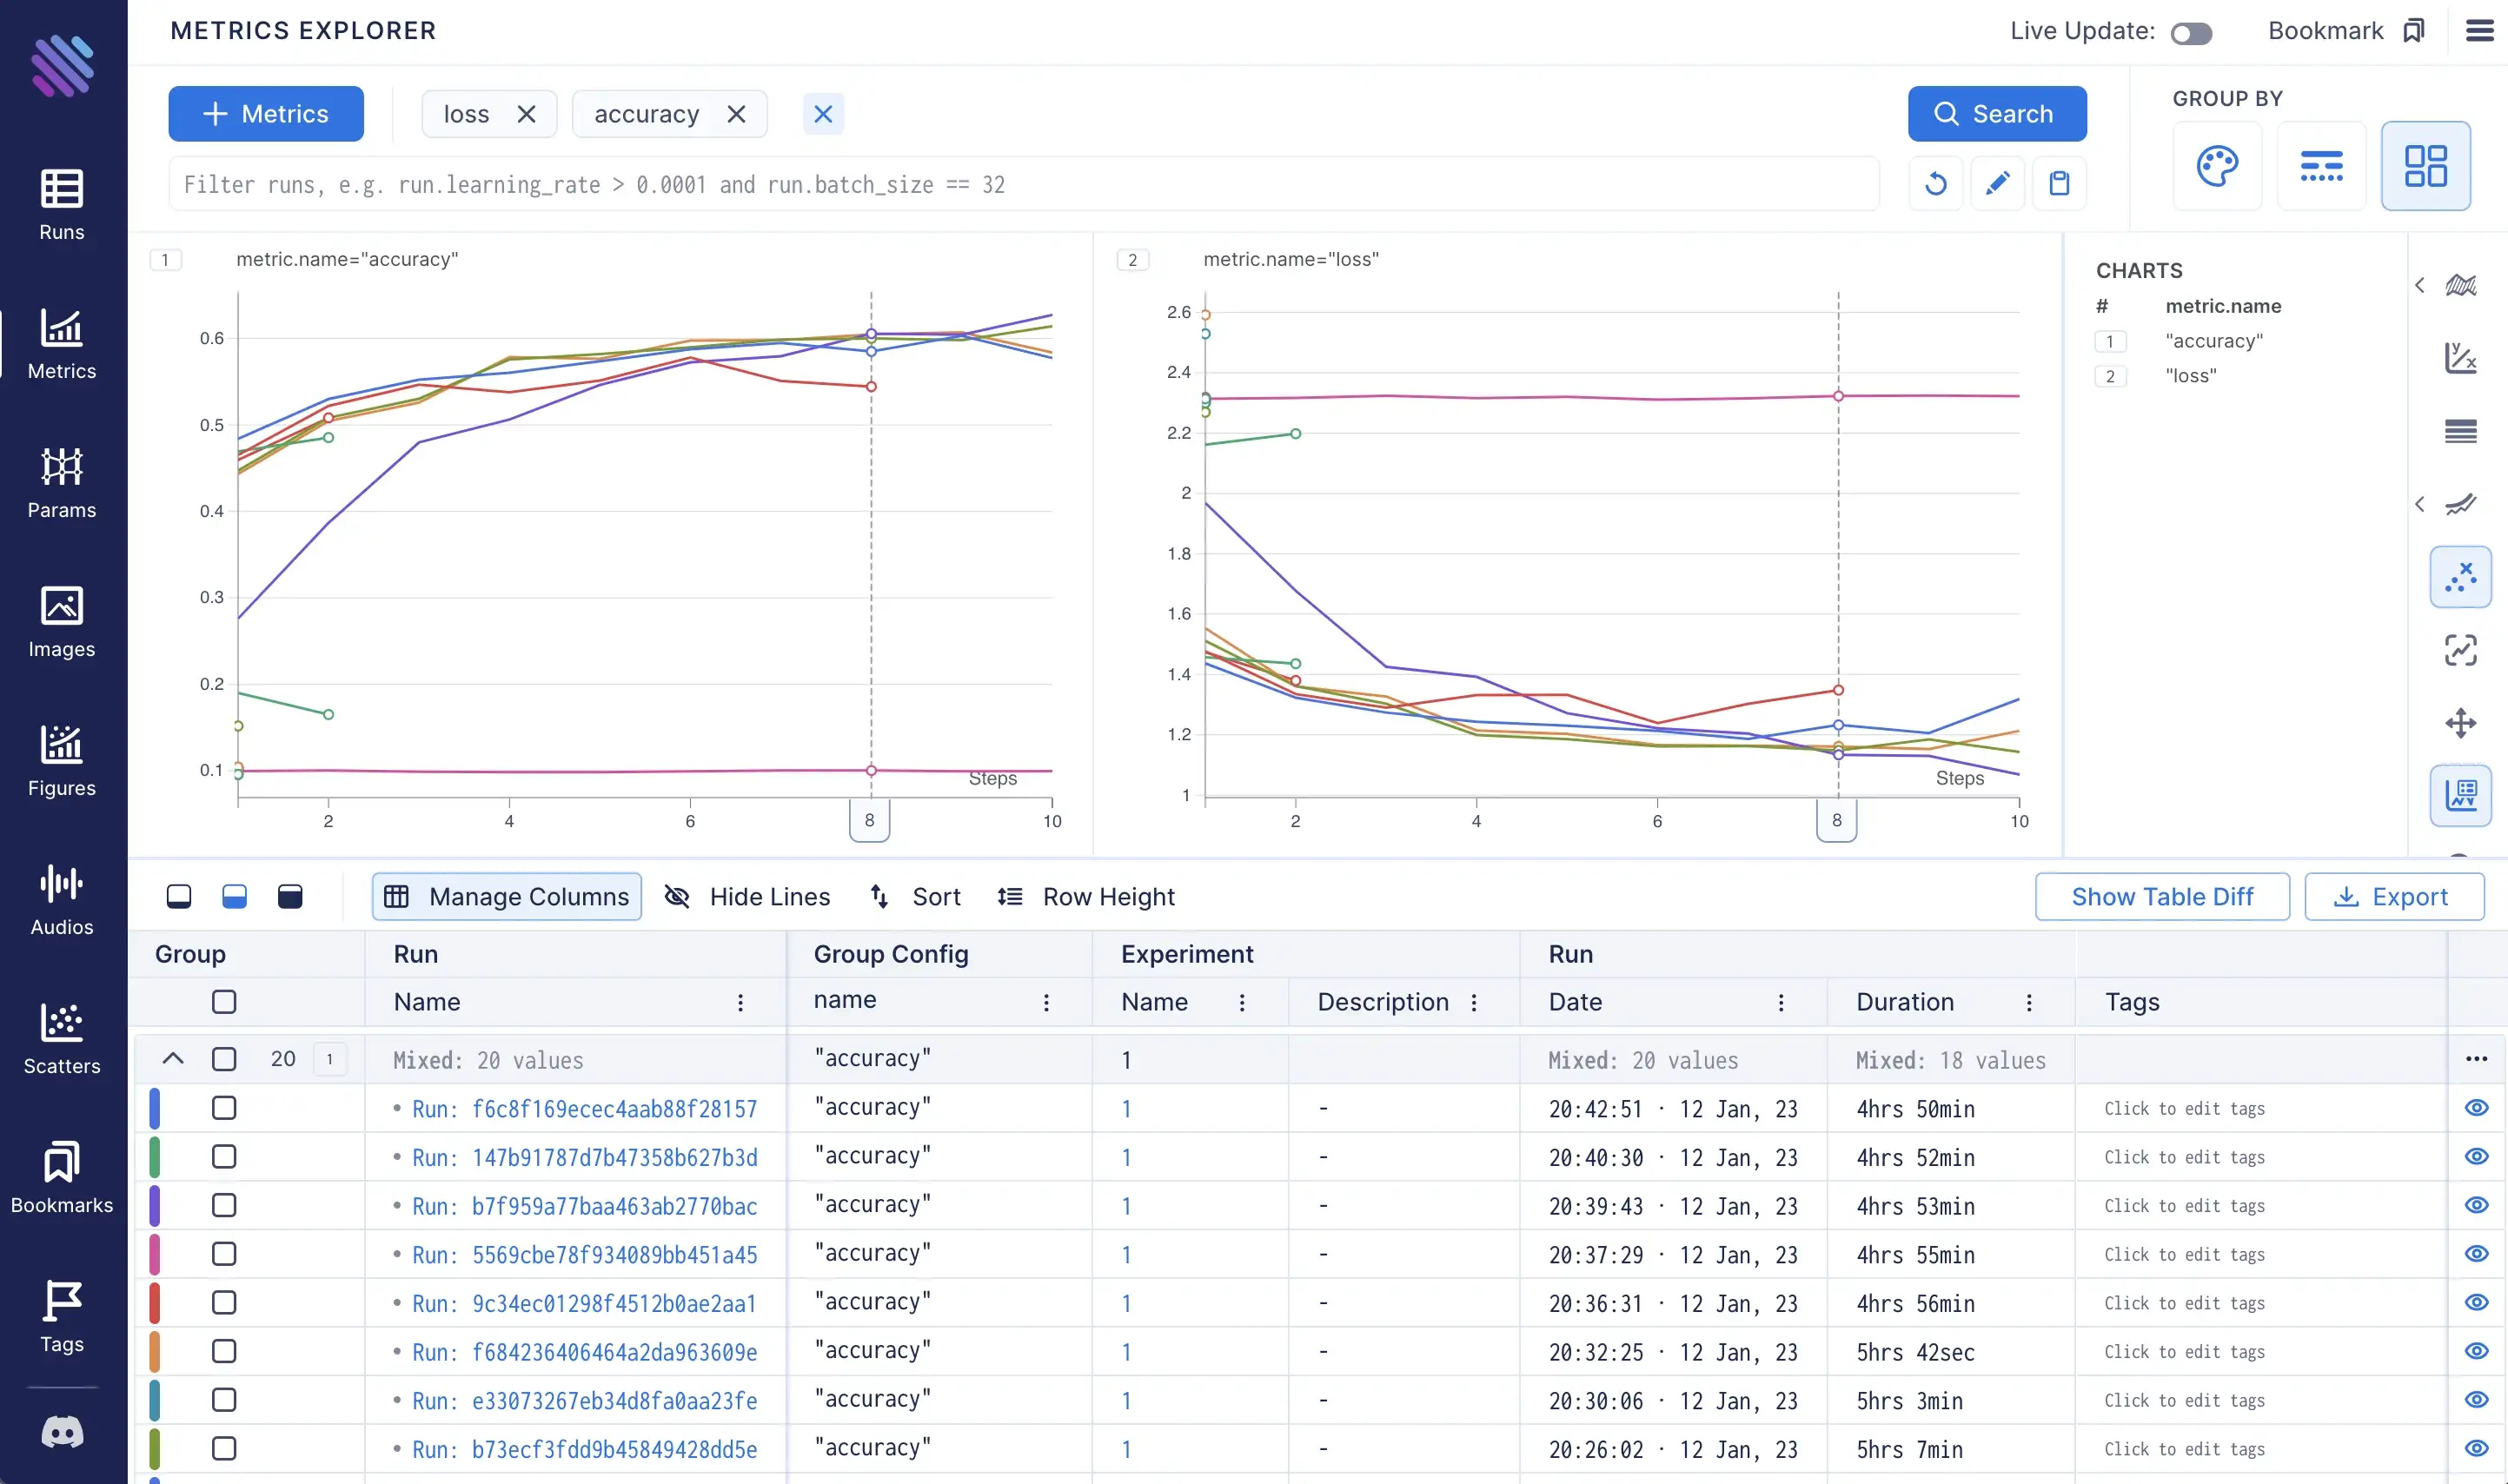
Aim comes with powerful grouping capabilities. Grouping enables a way to divide metrics into subgroups based on some criteria and apply the corresponding style. Aim supports 3 grouping ways for metrics:
- by color — each group of metrics will be filled in with its unique color
- by stroke style — each group will have a unique stroke style (solid, dashed, etc)
- by facet — each group of metrics will be displayed in a separate subplot
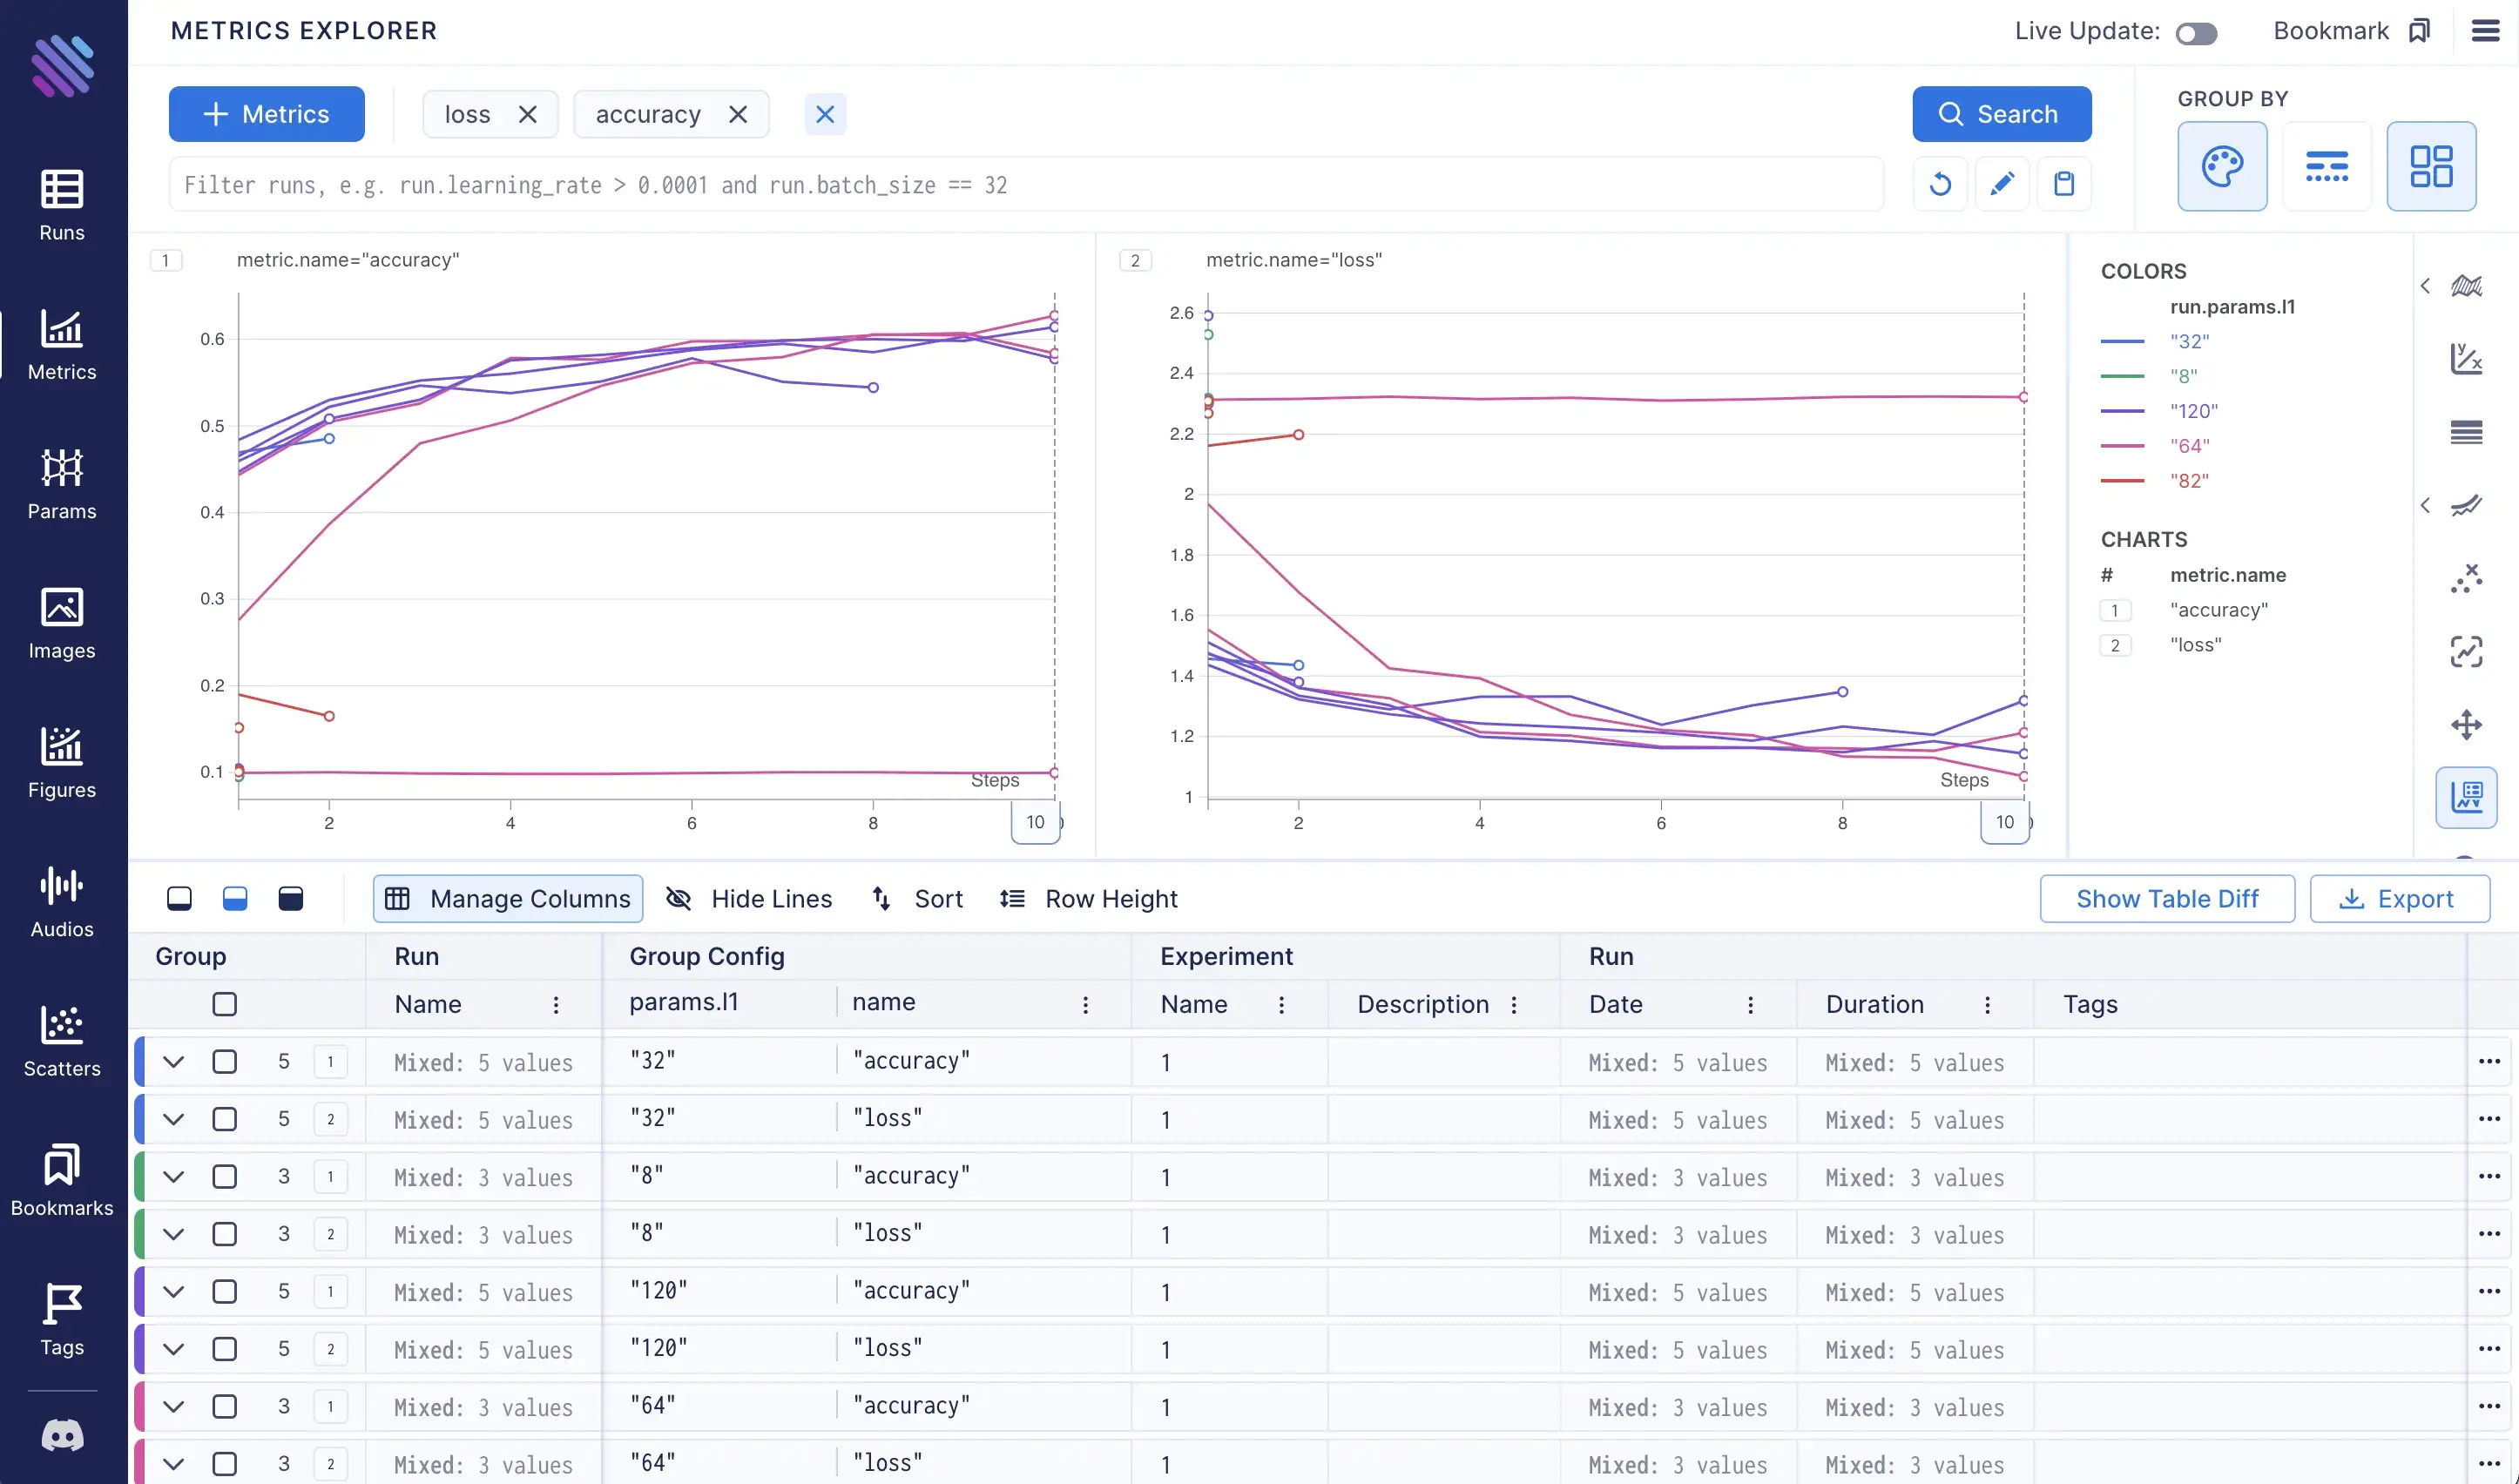
To learn which set of trials performed the best, let’s apply several groupings:
- Group by
run.hparams.l1hyper-parameter to color the picked metrics based on the number of outputs of the first fully connected layer - Group by
metric.nameto divide losses and accuracies into separate subplots (this grouping is applied by default)
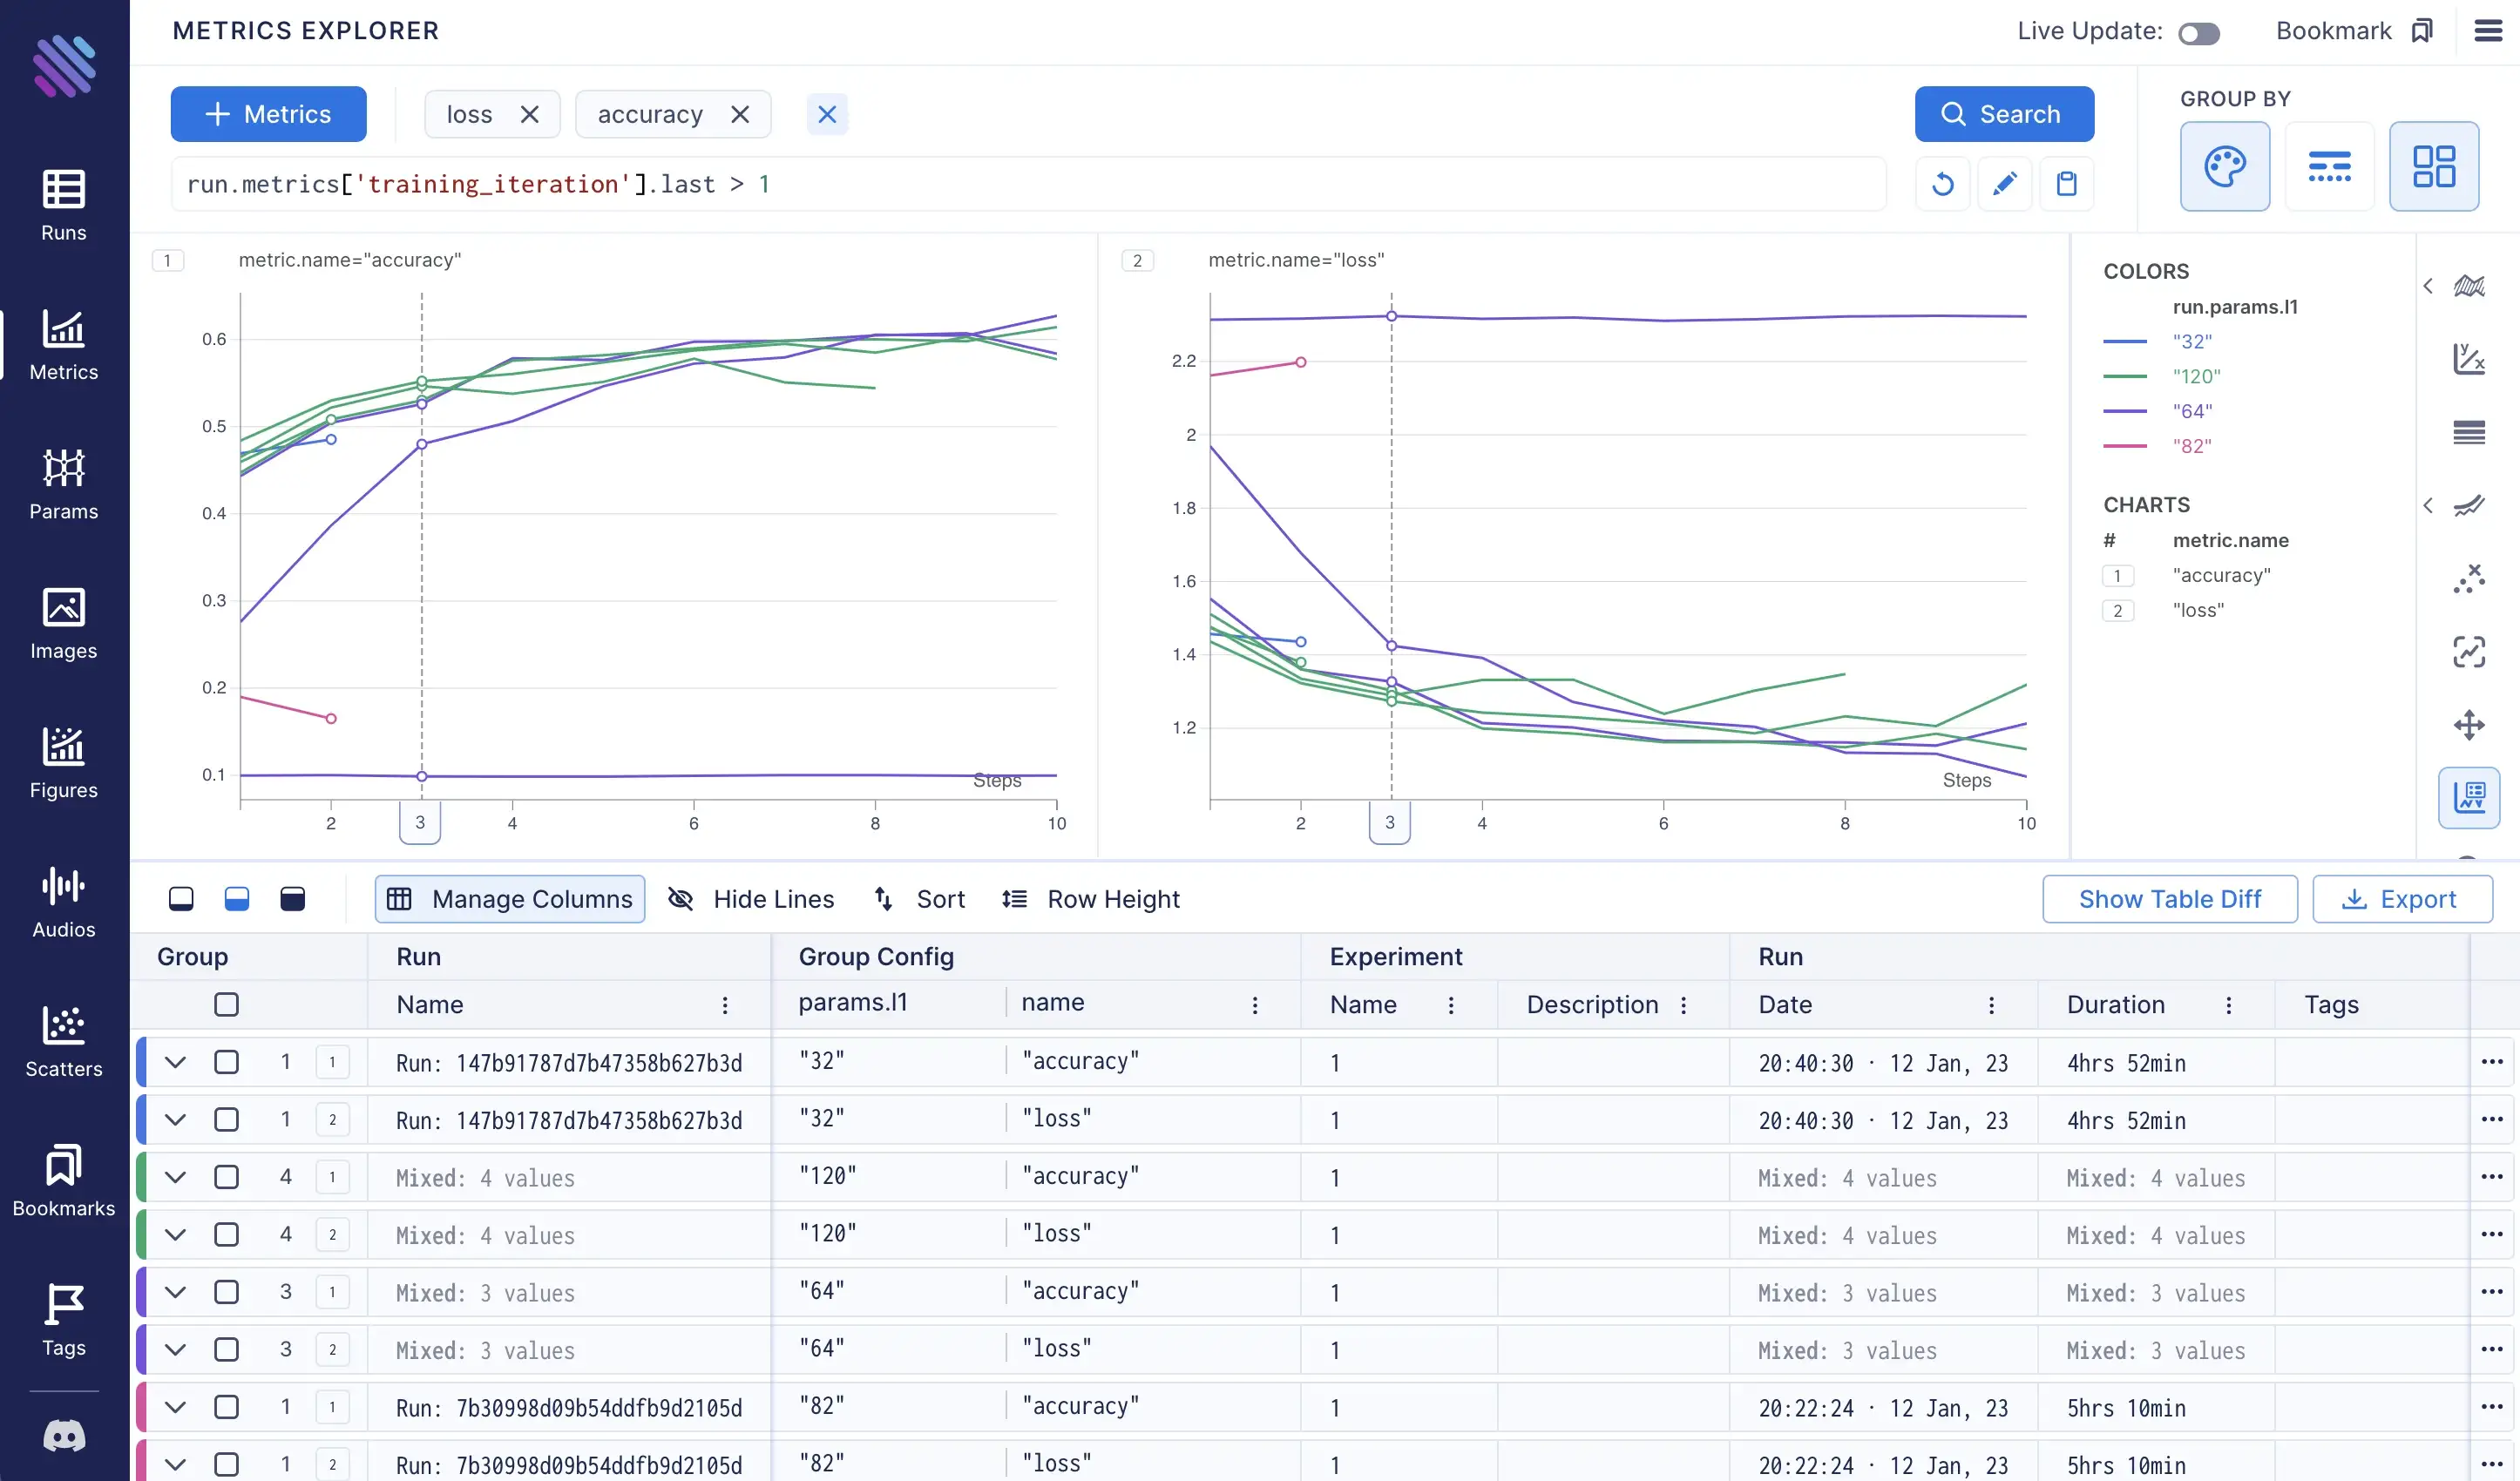
Aim also provides a way to select runs programmatically. It enables applying a custom query instead of just picking metrics of all the runs. Aim query supports python syntax, allowing us to access the properties of objects by dot operation, make comparisons, and perform more advanced python operations.
For example, in order to display only runs that were trained for more than one iteration, we will run the following query:
run.metrics['training_iteration'].last > 1Read more about Aim query language capabilities in the docs: https://aimstack.readthedocs.io/en/latest/using/search.html
This will result in querying and displaying 9 matched runs:
Let’s aggregate the groups to see which one performed the best:
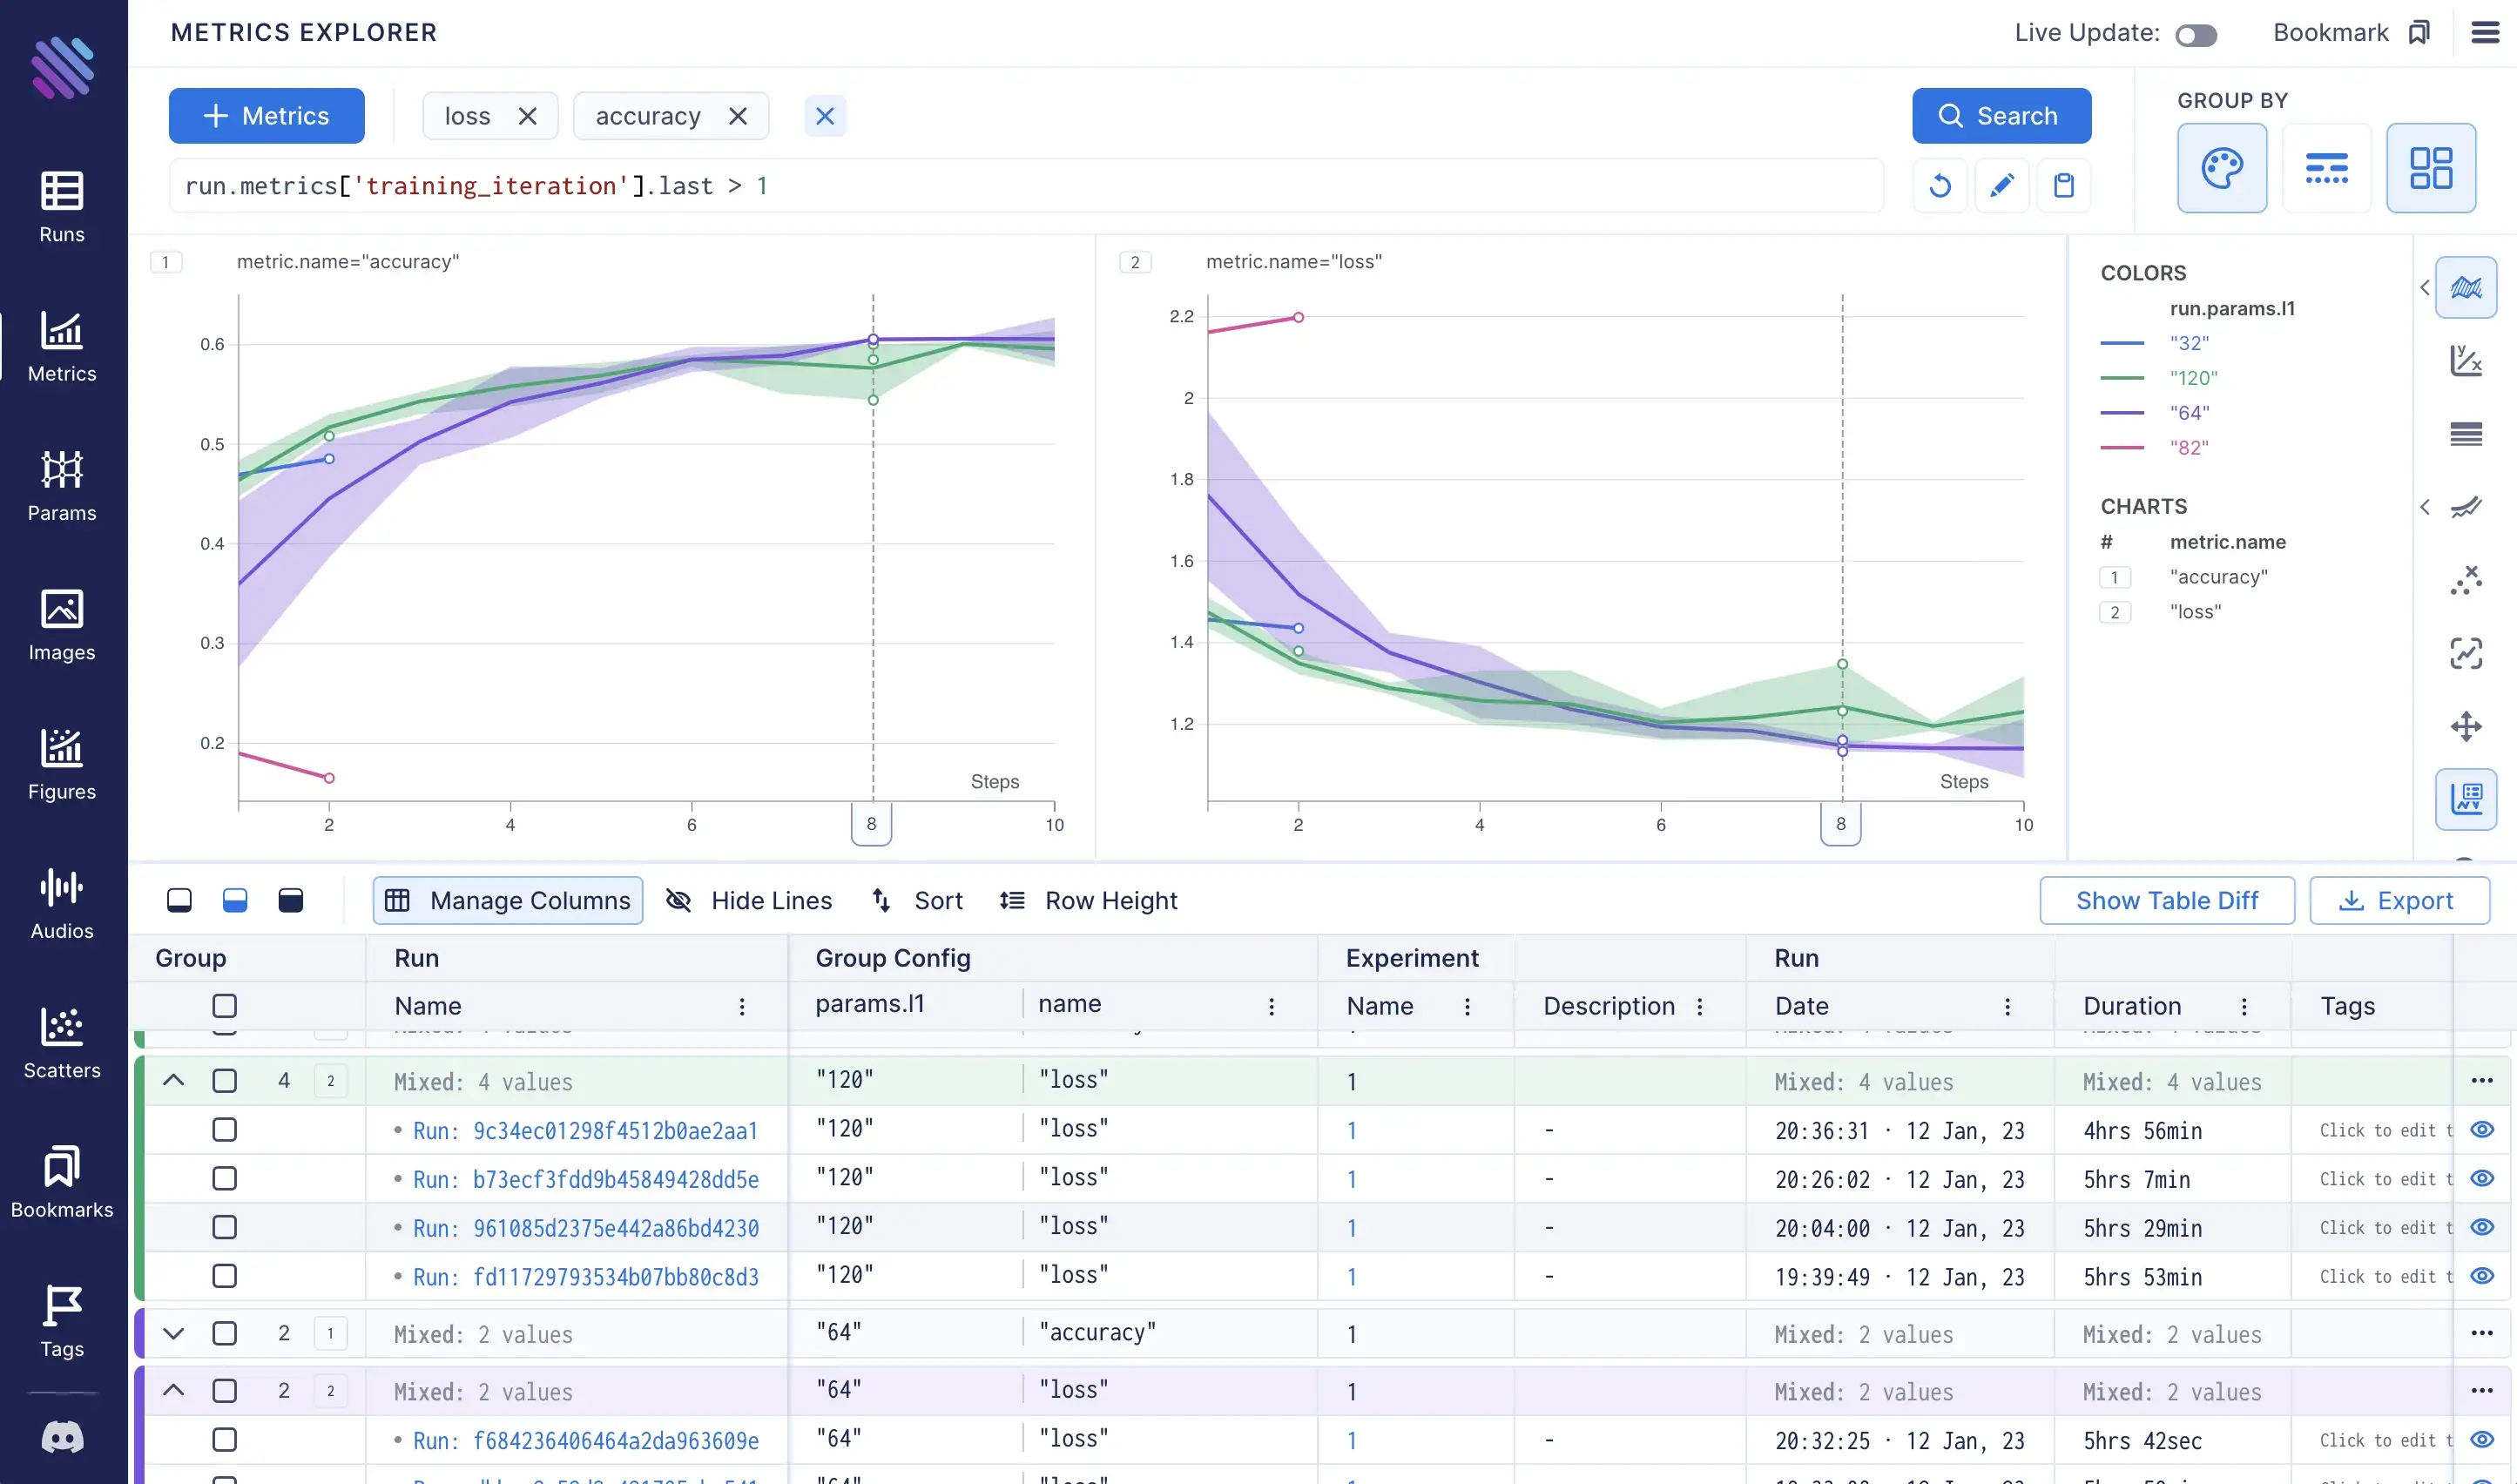
From the visualizations, it is obvious that the purple group achieved better performance compared to the rest. This means that the trials that had 64 outputs in the first fully connected layer achieved the best performance. 🎉
For more please see Aim official docs here: https://aimstack.readthedocs.io/en/latest/
Last, but not least: a closer look at Aim’s key features
- Use powerful pythonic search to select the runs you want to analyze:
Group metrics by hyperparameters to analyze hyperparameters’ influence on run performance:
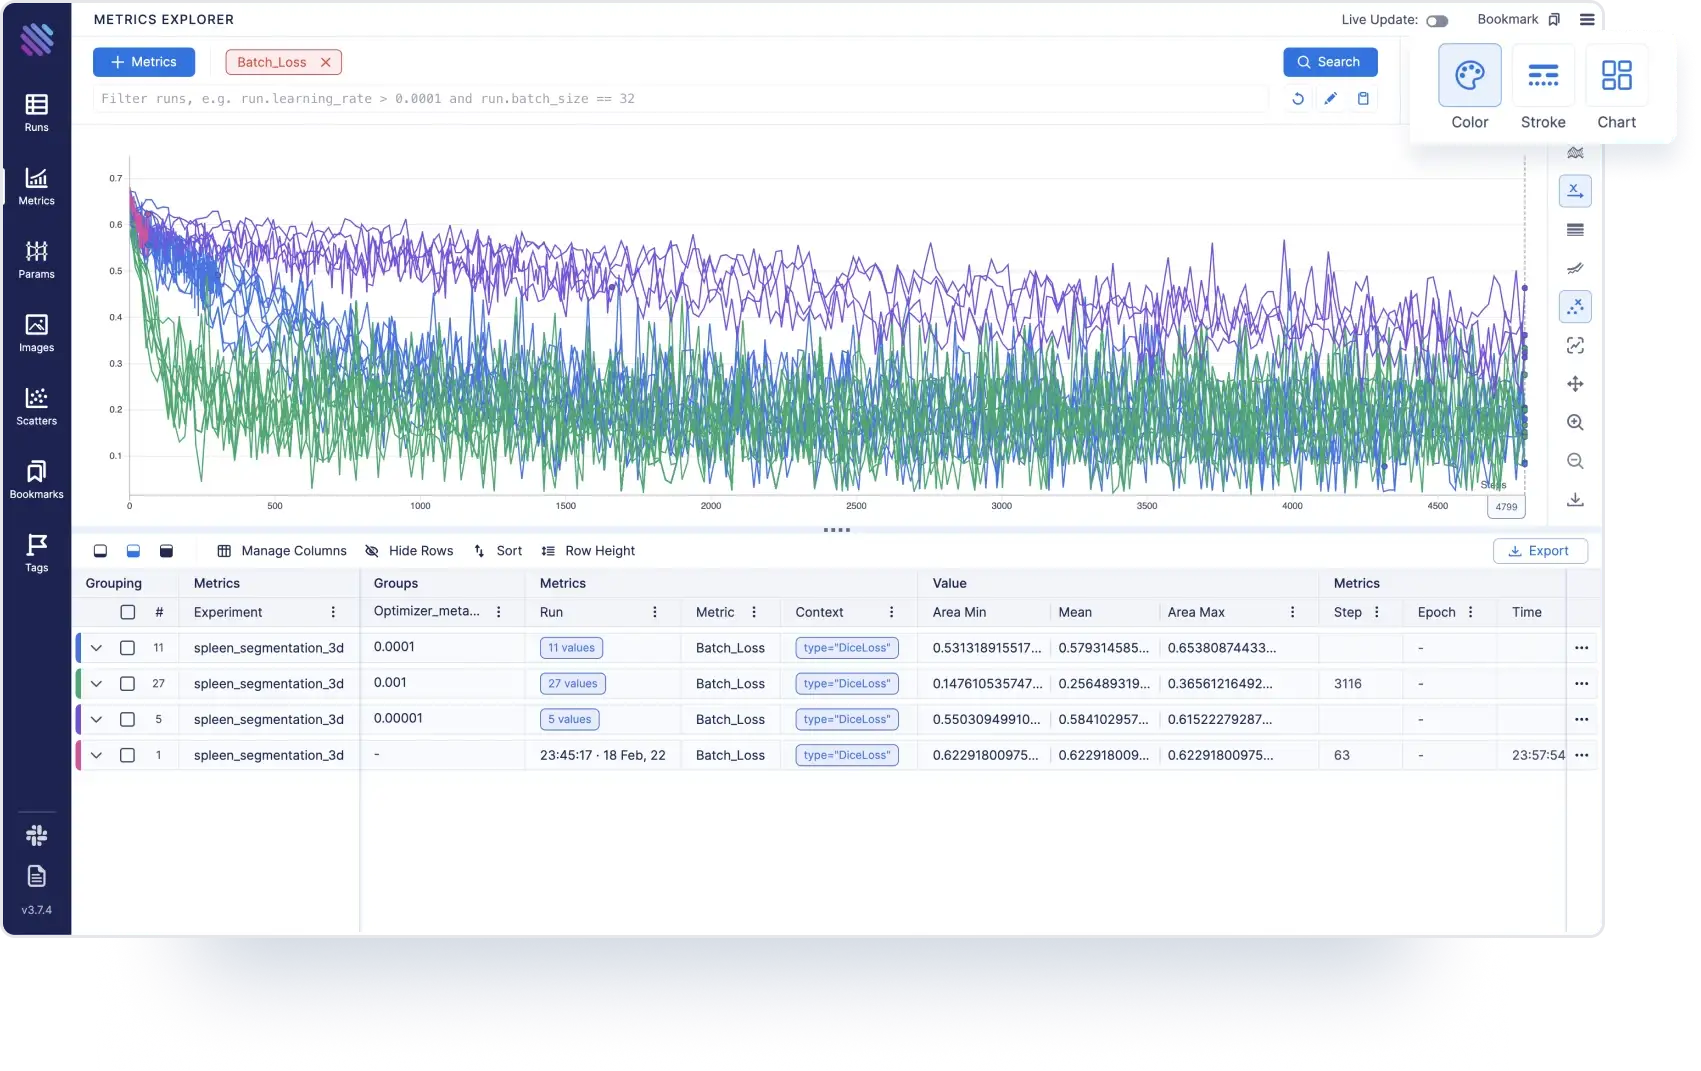
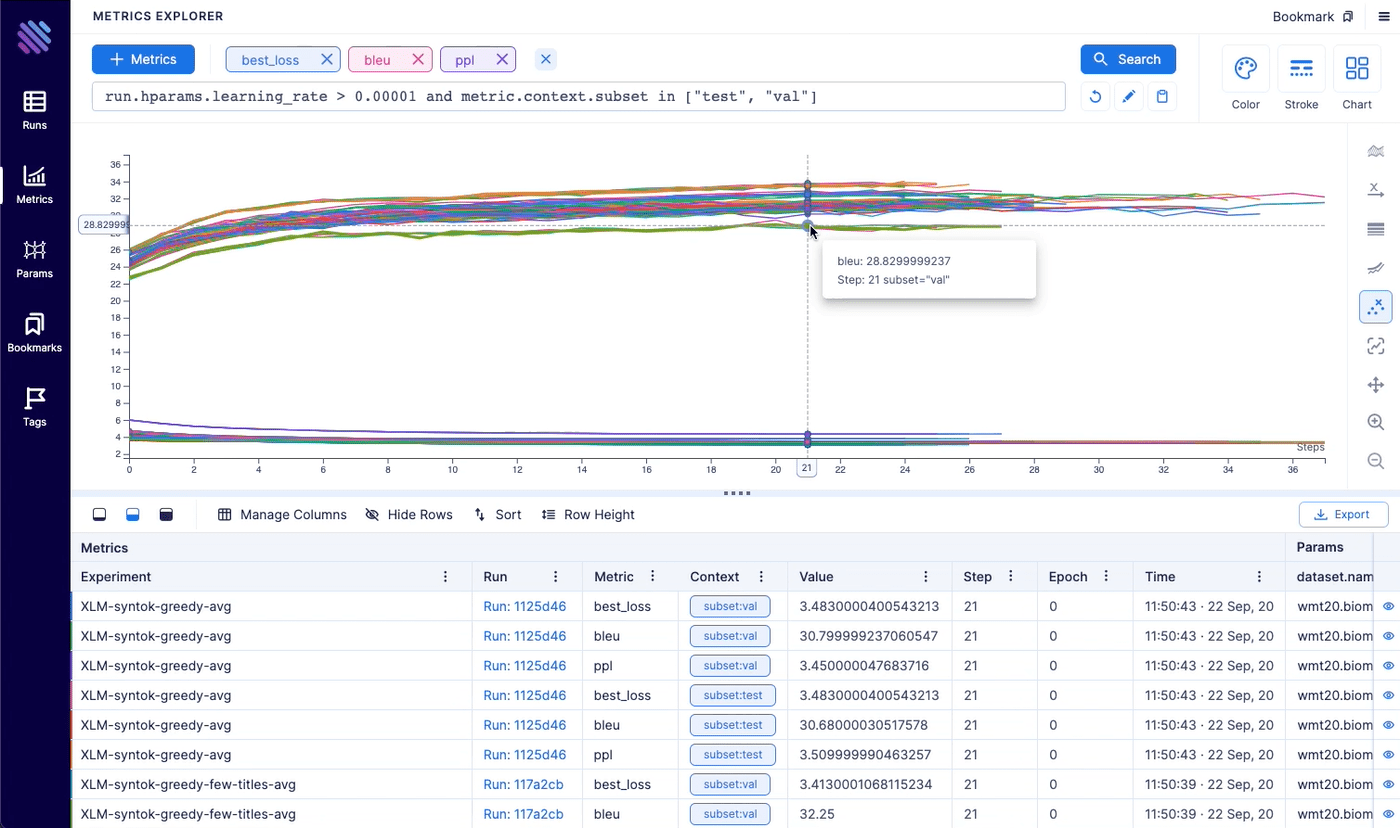
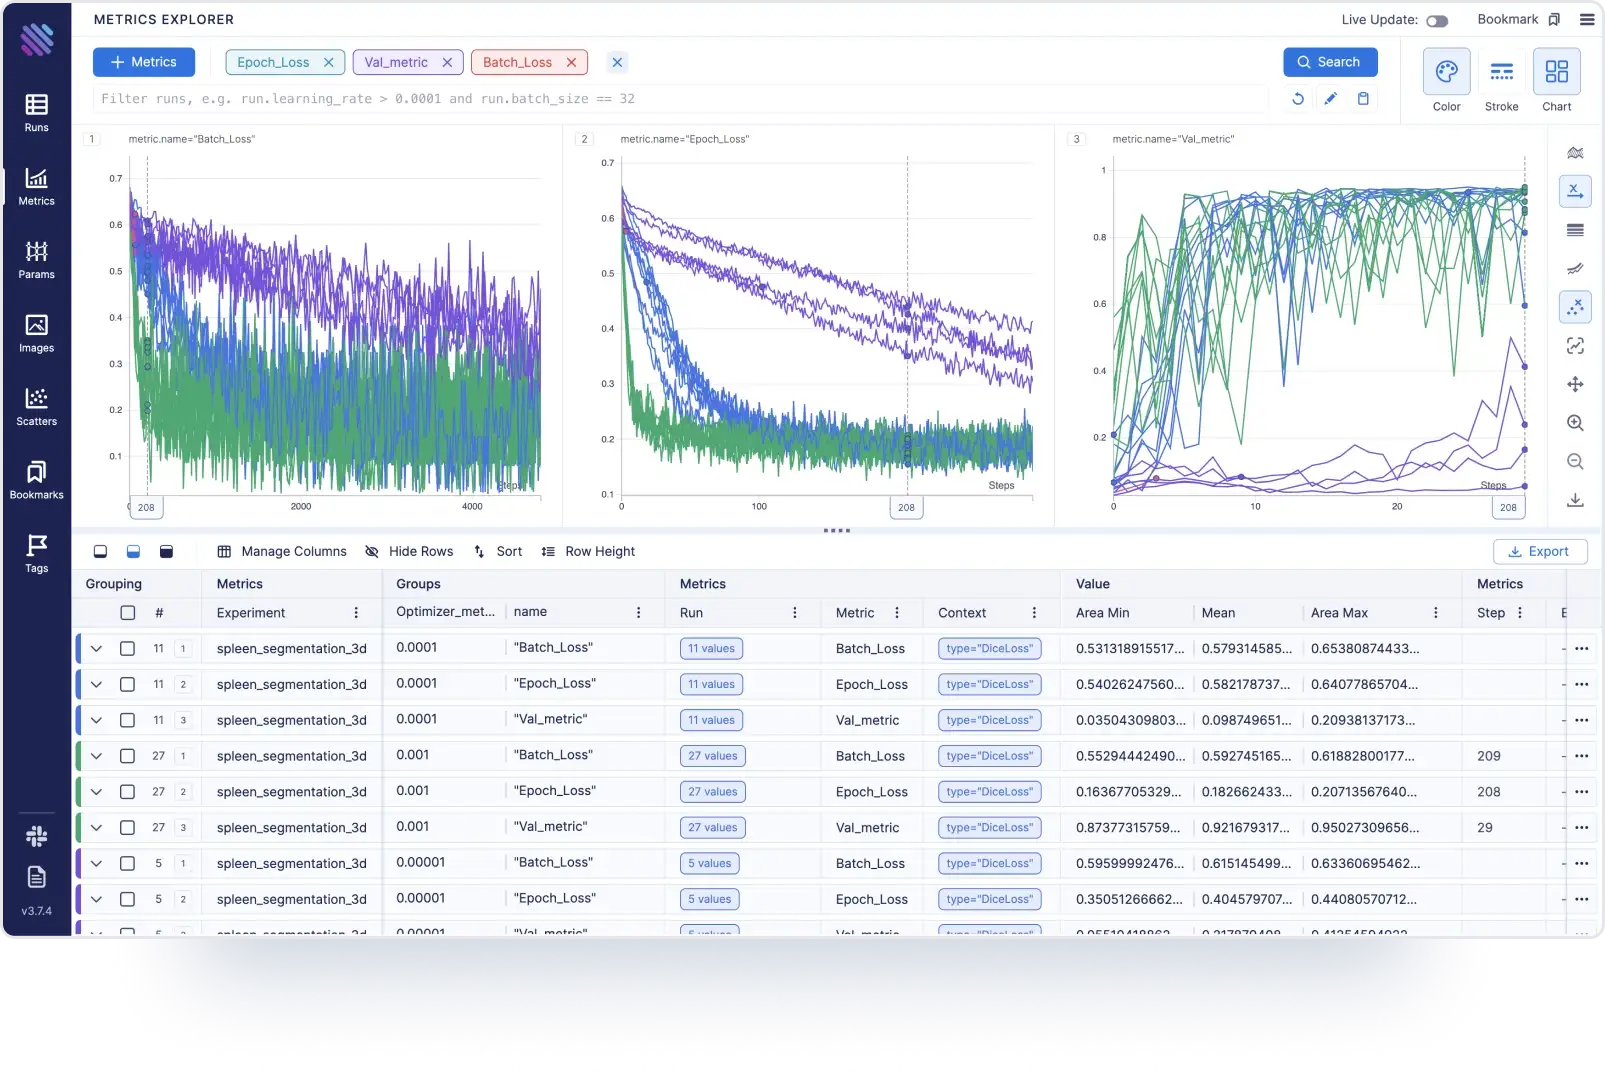
Select multiple metrics and analyze them side by side:
Aggregate metrics by std.dev, std.err, conf.interval:
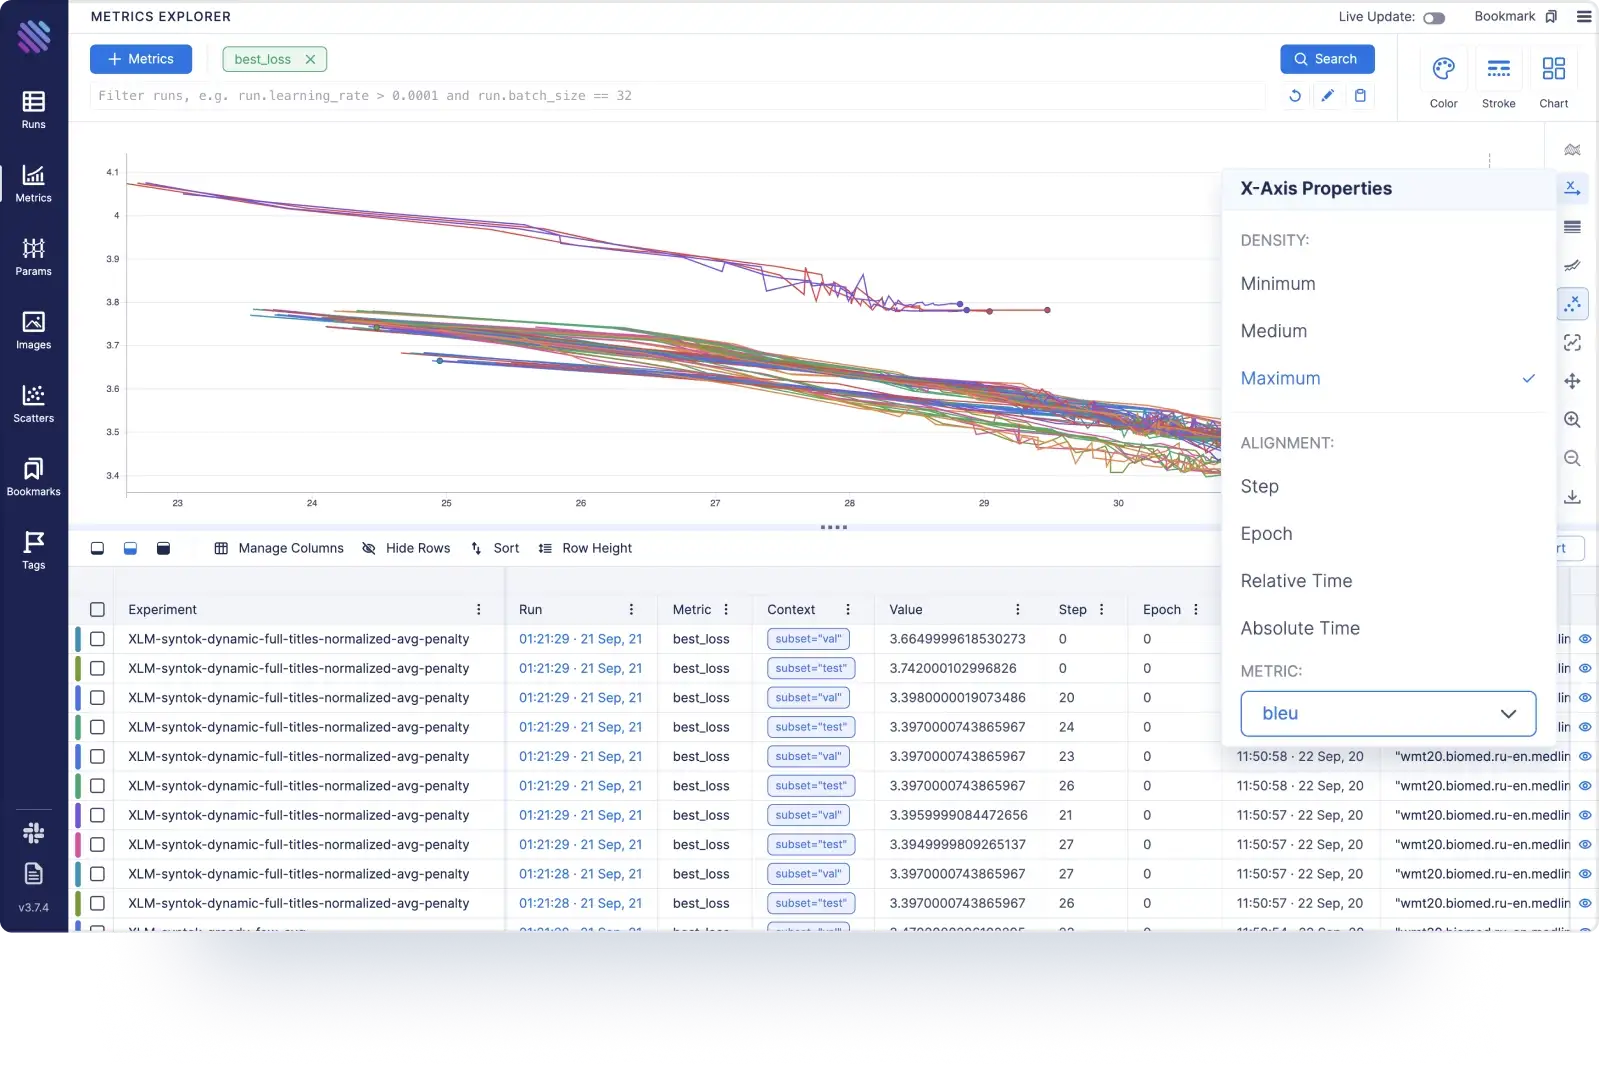
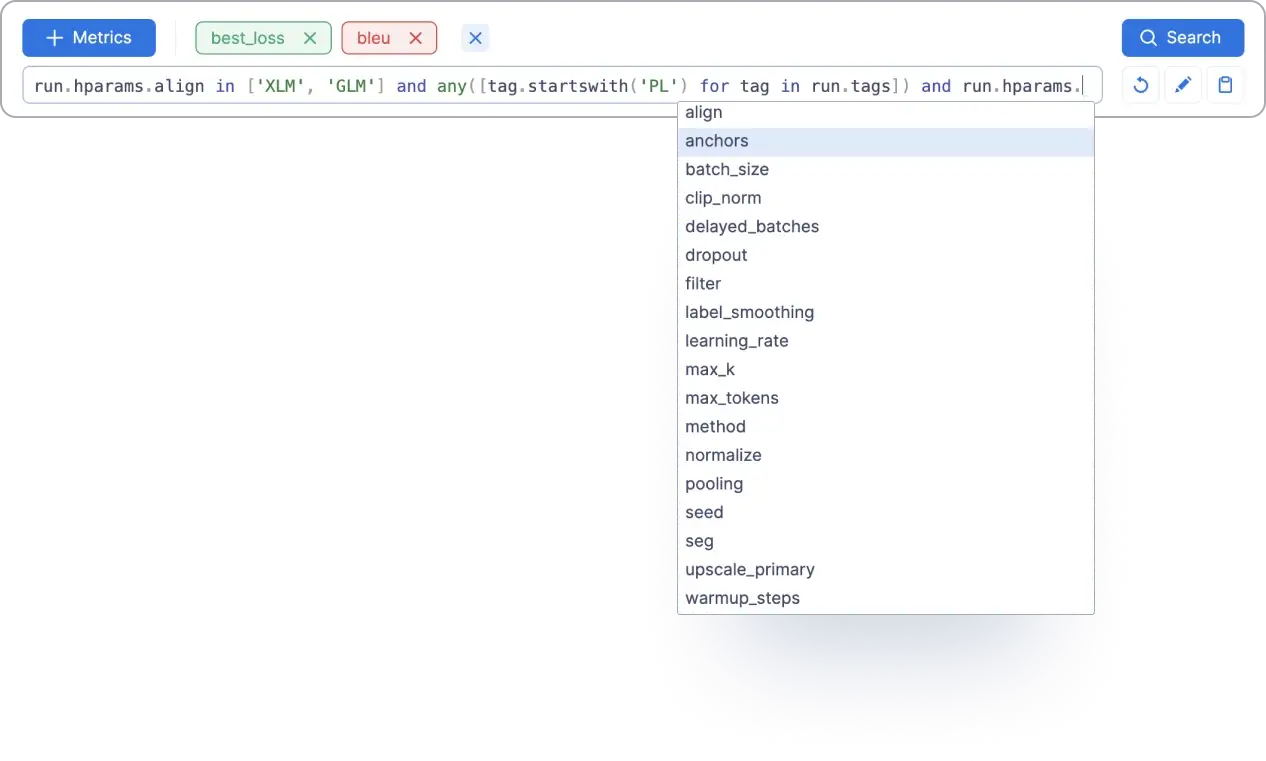
Align x axis by any other metric:
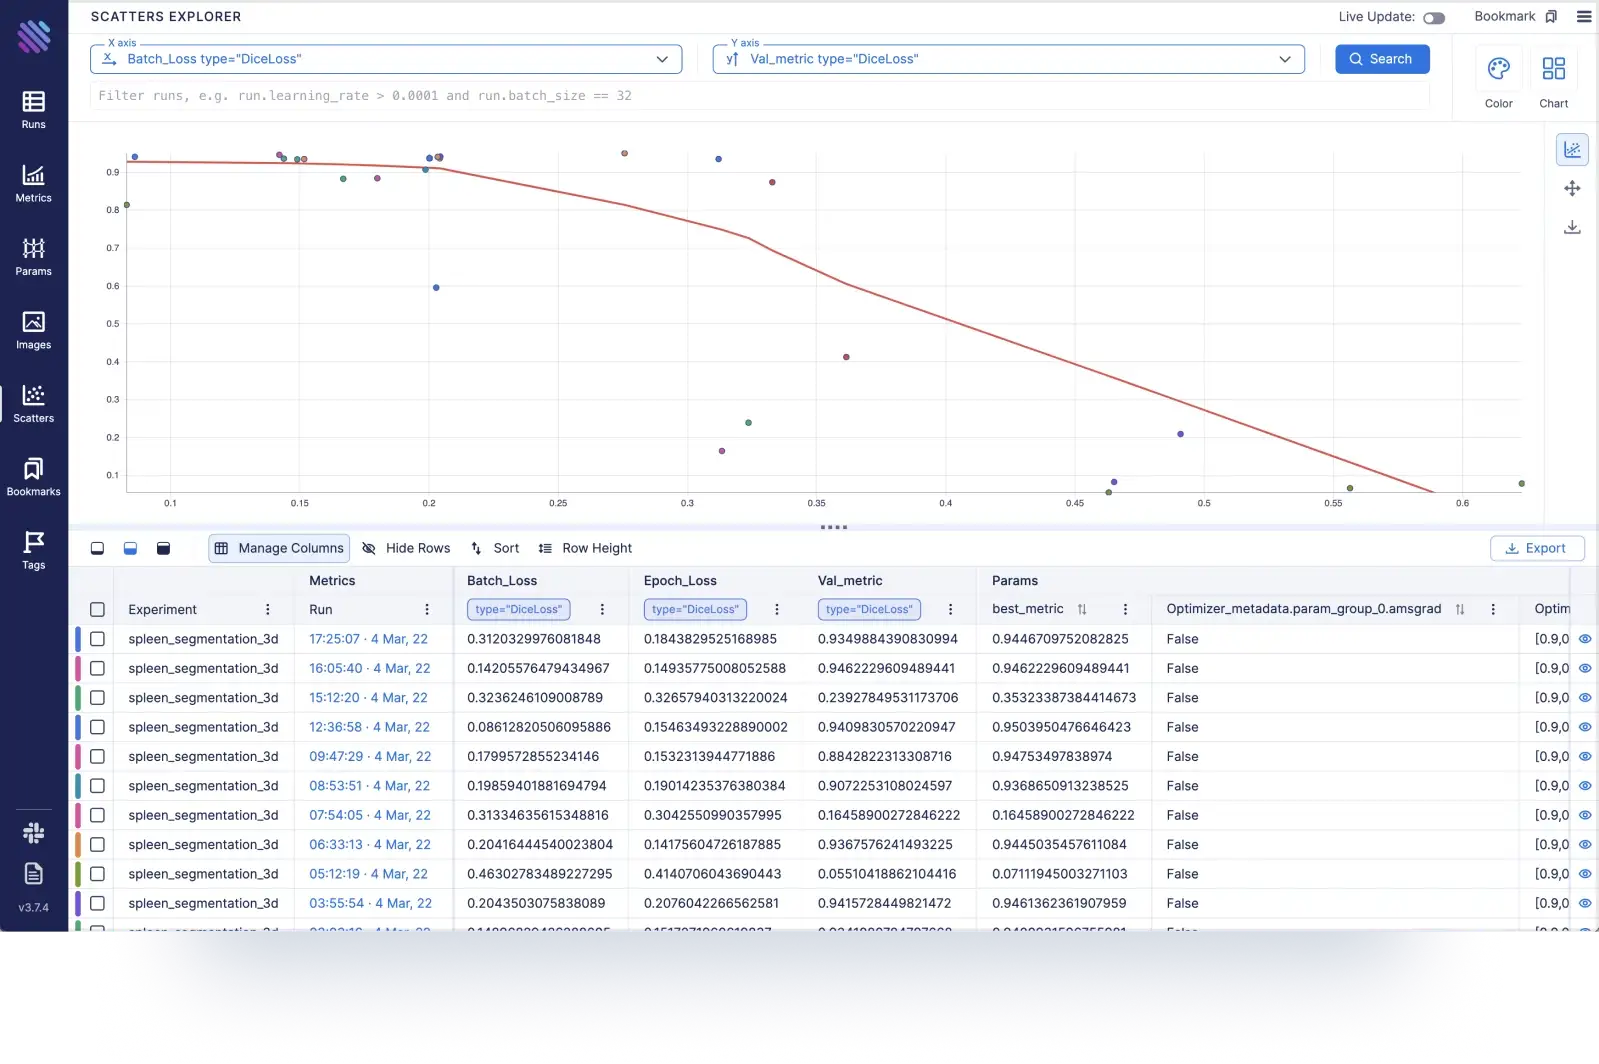
Scatter plots to learn correlations and trends:
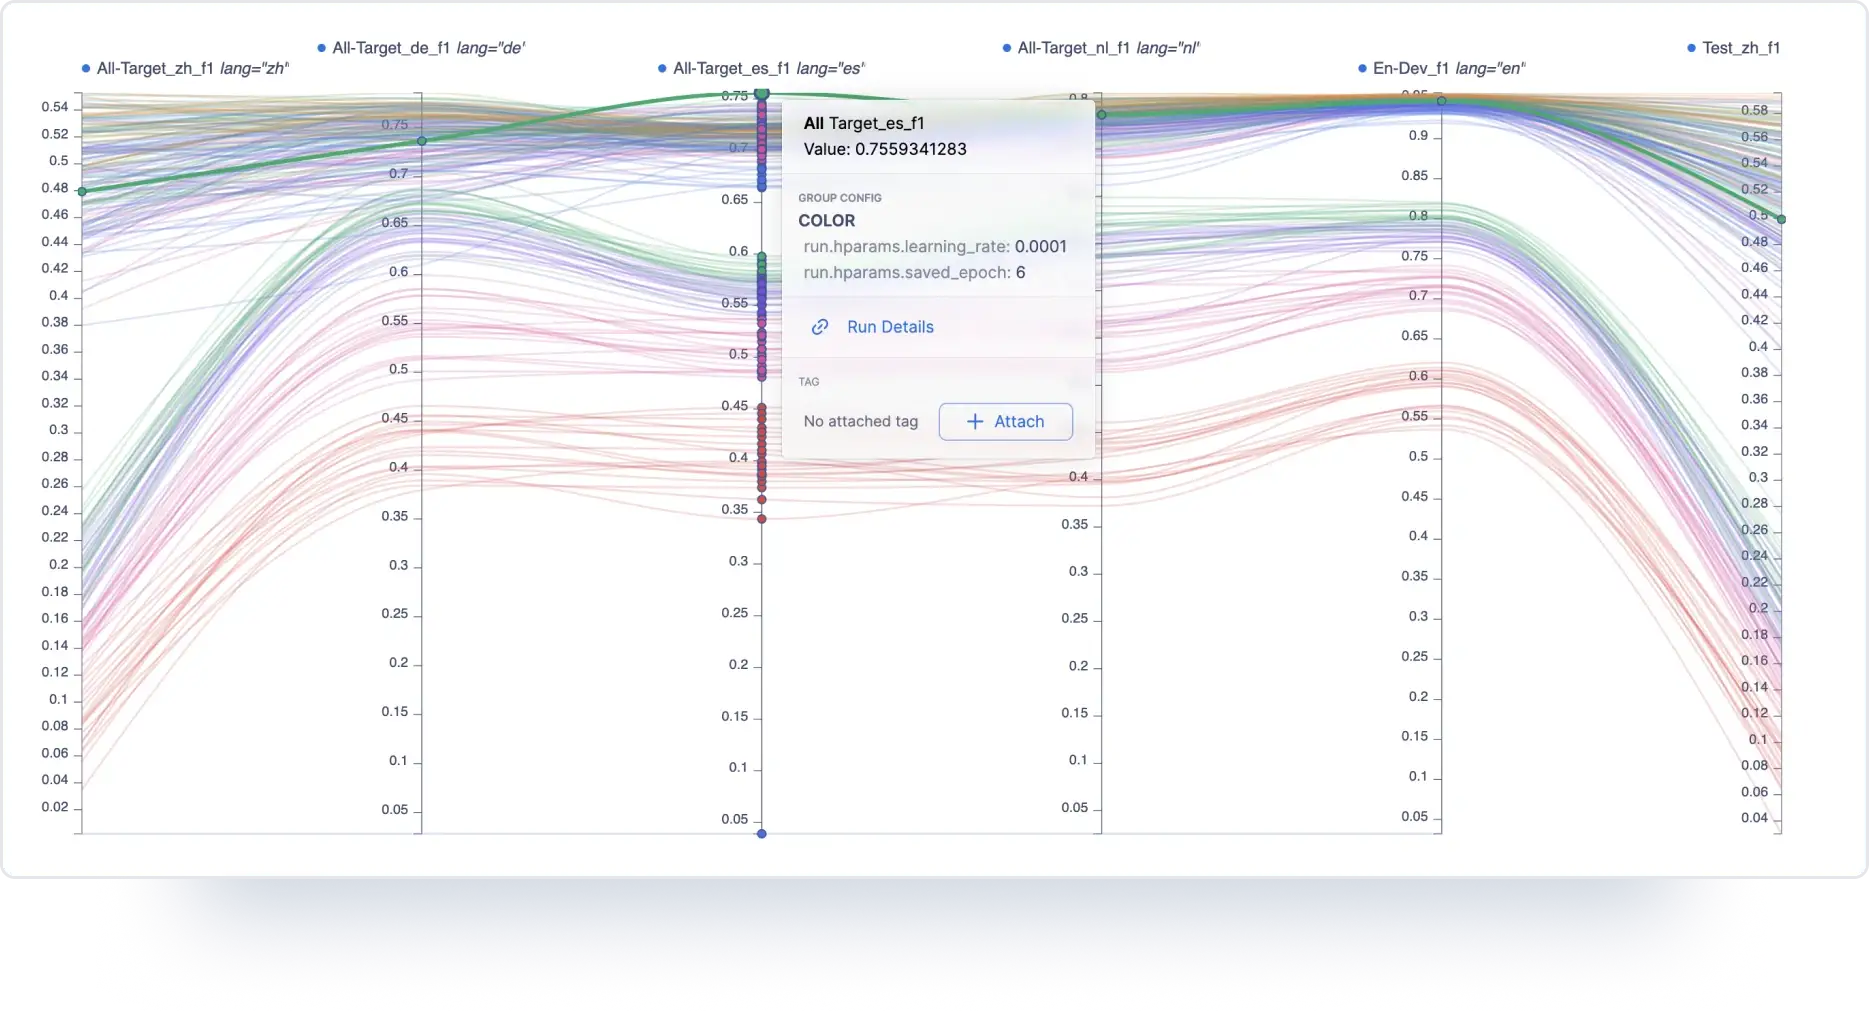
High dimensional data visualization via parallel coordinate plot:
Explore media metadata, such as images and audio objects via Aim Explorers:

Conclusion
In conclusion, Aim enables a completely new level of open-source experiment tracking and aimlflow makes it available for MLflow users with just a few commands and zero code change!
In this guide, we demonstrated how MLflow experiments can be explored with Aim. When it comes to exploring experiments, Aim augments MLflow capabilities by enabling rich visualizations and manipulations.
We covered the basics of Aim, it has much more to offer, with super fast query systems and a nice visualization interface. For more please read the docs.
Learn more
If you have any questions join Aim community, share your feedback, open issues for new features and bugs. 🙌
Show some love by dropping a ⭐️ on GitHub, if you think Aim is useful.