
We're excited to announce the release of Aim 3.25! This update brings two changes, including one highly requested by the community: Reports. 🎉
What’s New?
Reports 📝
The most anticipated feature for a long time. Reports are a powerful tool for organizing. documenting and sharing your experiment results.
Support for Self-Signed SSL Certificates ©️
Aim now supports self-signed SSL certificates, making it easier to use Aim in different infrastructure setups.
Reports are incredibly useful for ML engineers as they help to bring together the most important data about the experiments along with the knowledge.
Key Features of Aim Reports:
Use Aim reports to showcase your work and iterate over the knowledge around it. And of course, do it with your collaborators.
Process tracked metadata and produce new plots directly within the Aim UI, saving time by eliminating the need to write custom plotting functions.
Reports have unique URLs so it can be shared across others by sharing URL directly.
Reports work as a real-time markdown editor where you can embed queries to the data via regular python as well as use all the markdown abilities to document around.
Its as simple as that!
The following image shows an example of a report created from metrics that were logged to aim over the course of a training:

The report page
In a single report page, you can switch between two modes: `view` and `edit` .
Edit Mode: Create and customize your report by embedding visualizations and retrieving data from Aim storage.
View Mode: Once your report is ready, switch to view mode to see the final result.
The example shown below is an overview of the `edit` mode.

Data Retrieval & Visualization
Aim Reports make it easy to fetch and visualize different types of data from Aim’s storage:
- Metrics: Use methods like `repo.fetch_metrics()` to retrieve and visualize key metrics such as loss or accuracy.
- Images, Audio, and More: Fetch other data types like images (`repo.fetch_images()` ), audio, figures, and text.
- Visualization: Visualize your data with objects like `LineChart` , `ImagesList` , and `AudiosList` . For example, to visualize a loss curve, you can use:
metrics = repo.fetch_metrics('metric.name == "loss"')
linechart = LineChart(metrics)
Grouping: You can group your data for better analysis using properties like color, stroke style, or even by metric names and contexts.
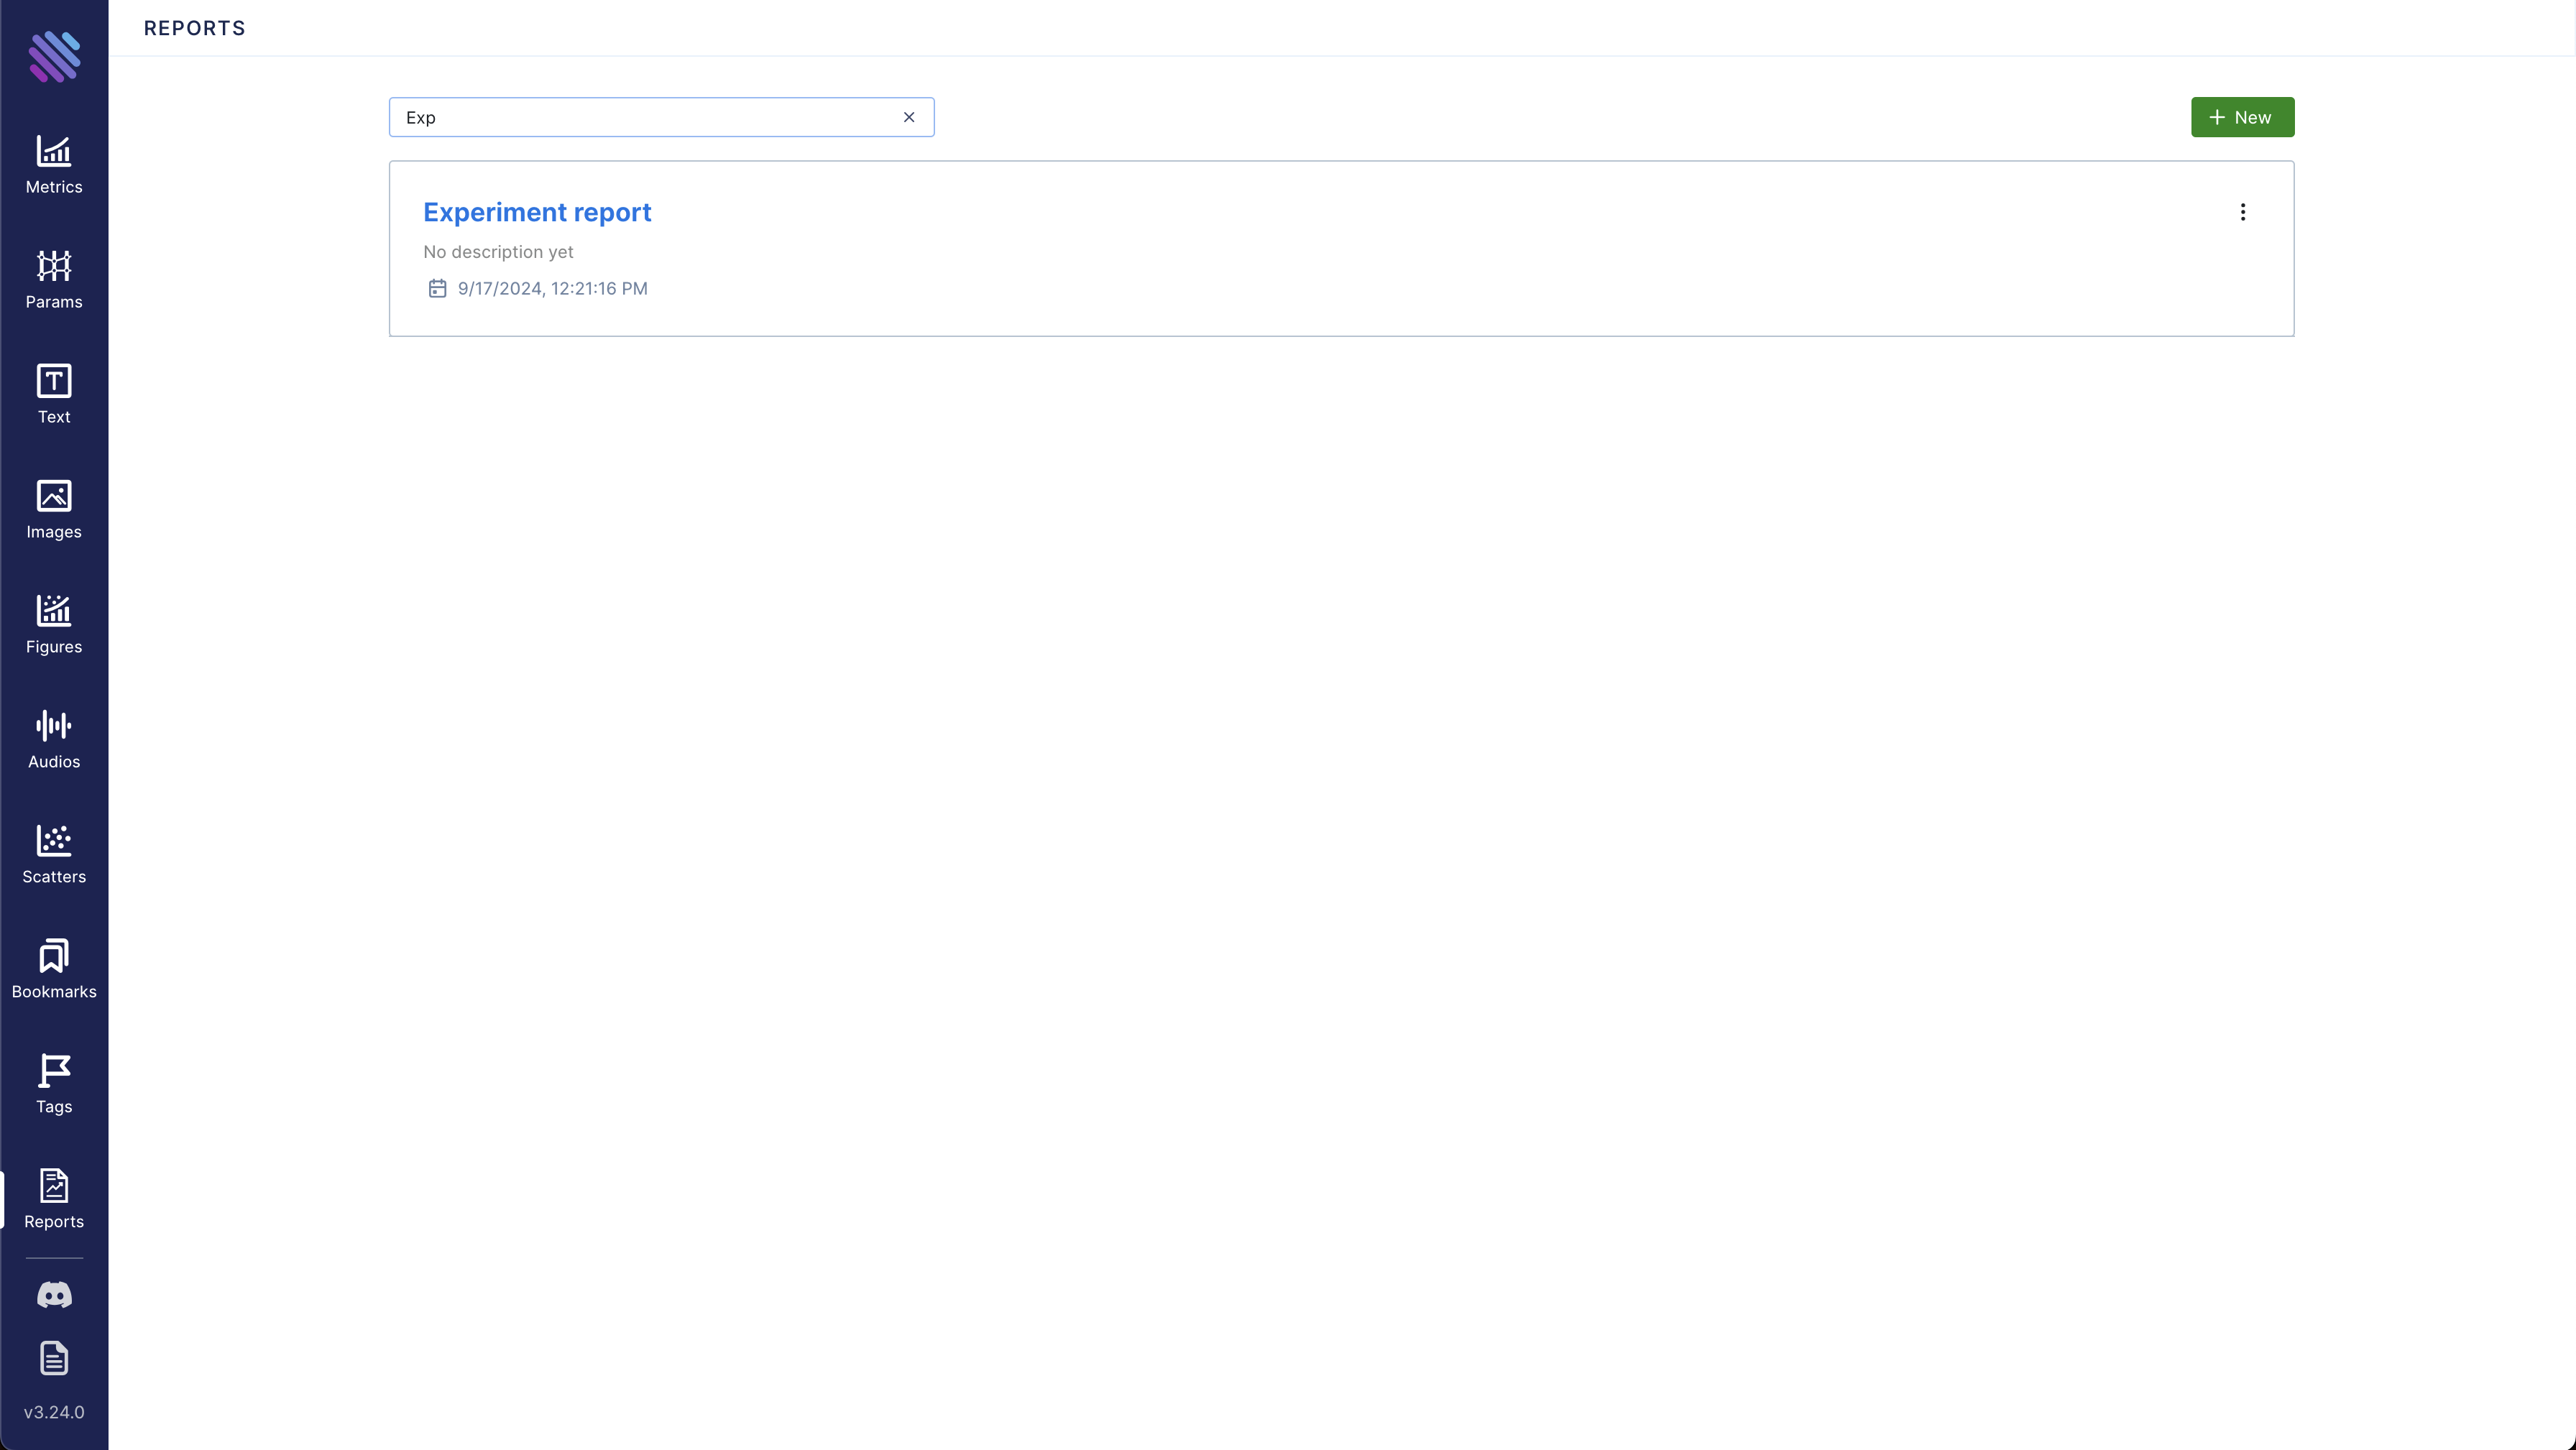
Search and Delete Reports
Aim’s report pages include a Search bar, making it easy to find the report you need. Additionally, the Delete button allows you to quickly remove reports you no longer need, streamlining report management.

Example Use Case
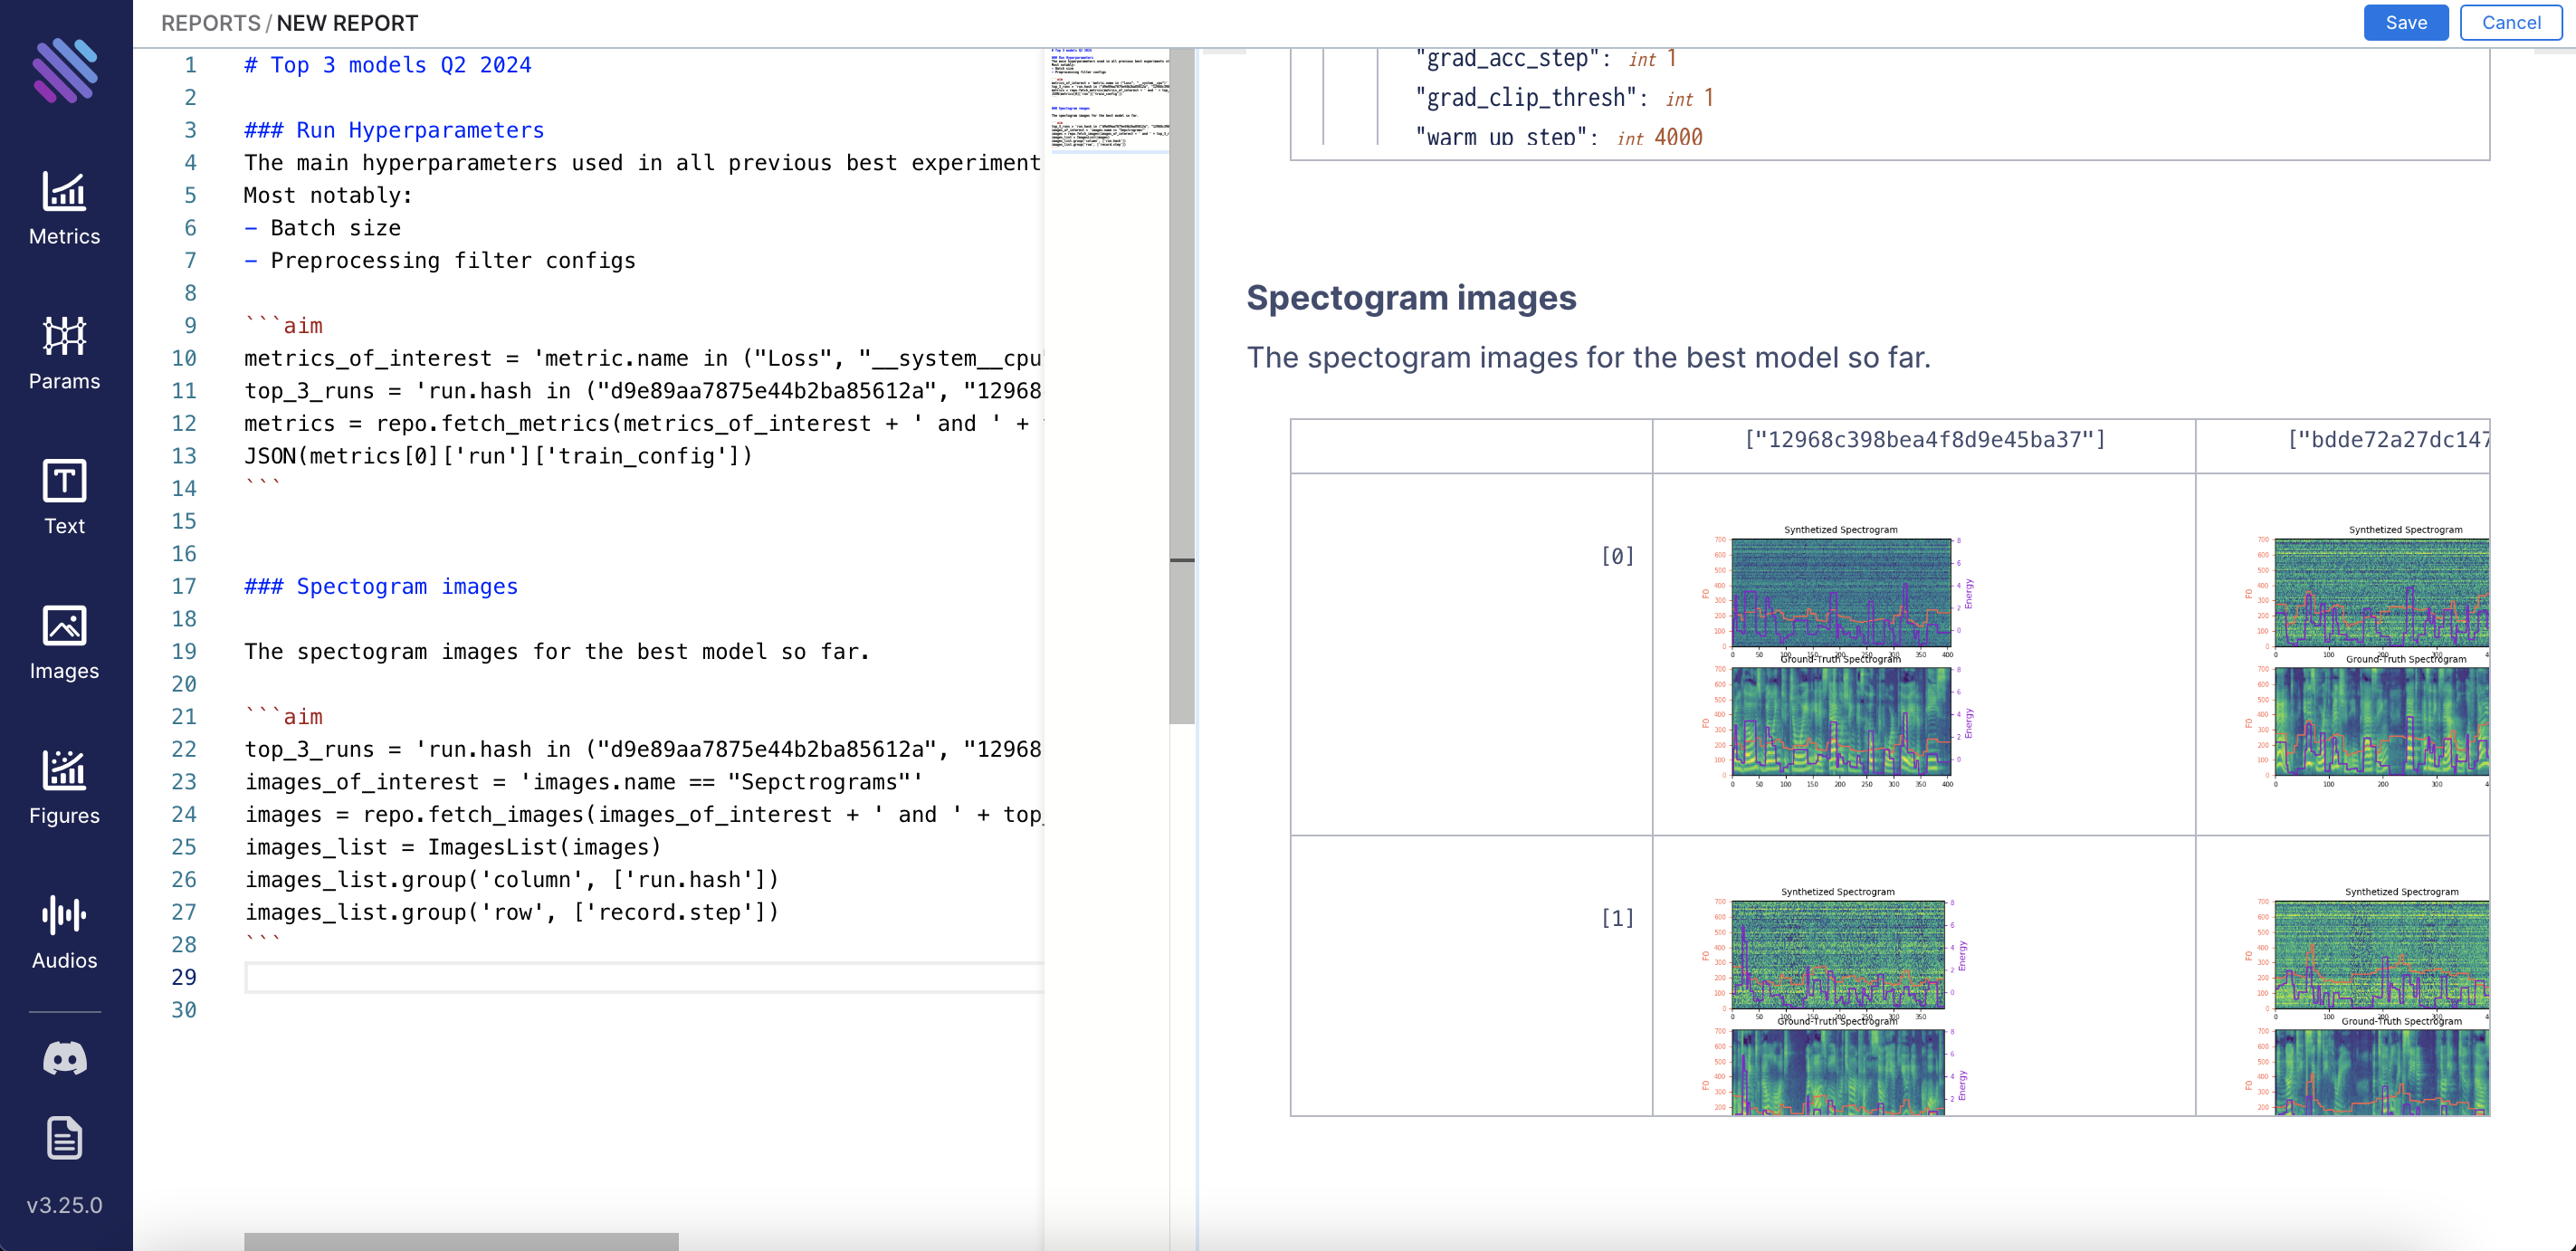
Let’s create a new report together about Top 3 models Q2 2024:
Here it is:
As we already know the exact runs of interest, we will start putting in some of the metadata about them.
Note: more elaborate way of visualizing the metadata will be added soon. For now lets use the JSON.
# Top 3 models Q2 2024

### Run Hyperparameters
The main hyperparameters used in all previous best experiments still used in this one.
Most notably:
- Batch size
- Preprocessing filter configs

```aim
metrics_of_interest = 'metric.name in ("Loss", "__system__cpu")'
top_3_runs = 'run.hash in ("d9e89aa7875e44b2ba85612a", "12968c398bea4f8d9e45ba37", "bdde72a27dc147538eb1b649")'
metrics = repo.fetch_metrics(metrics_of_interest + ' and ' + top_3_runs)
JSON(metrics[0]['run']['train_config'])
Whats more important for us: compare the loss metrics, the speech-to-text predicted spectograms and the audios.
Lets start from the spectograms:
### Spectogram images

The spectogram images for the best model so far.

```aim
top_3_runs = 'run.hash in ("d9e89aa7875e44b2ba85612a", "12968c398bea4f8d9e45ba37", "bdde72a27dc147538eb1b649")'
images_of_interest = 'images.name == "Sepctrograms"'
images = repo.fetch_images(images_of_interest + ' and ' + top_3_runs)
images_list = ImagesList(images)
images_list.group('column', ['run.hash'])
images_list.group('row', ['record.step'])
```
The result:
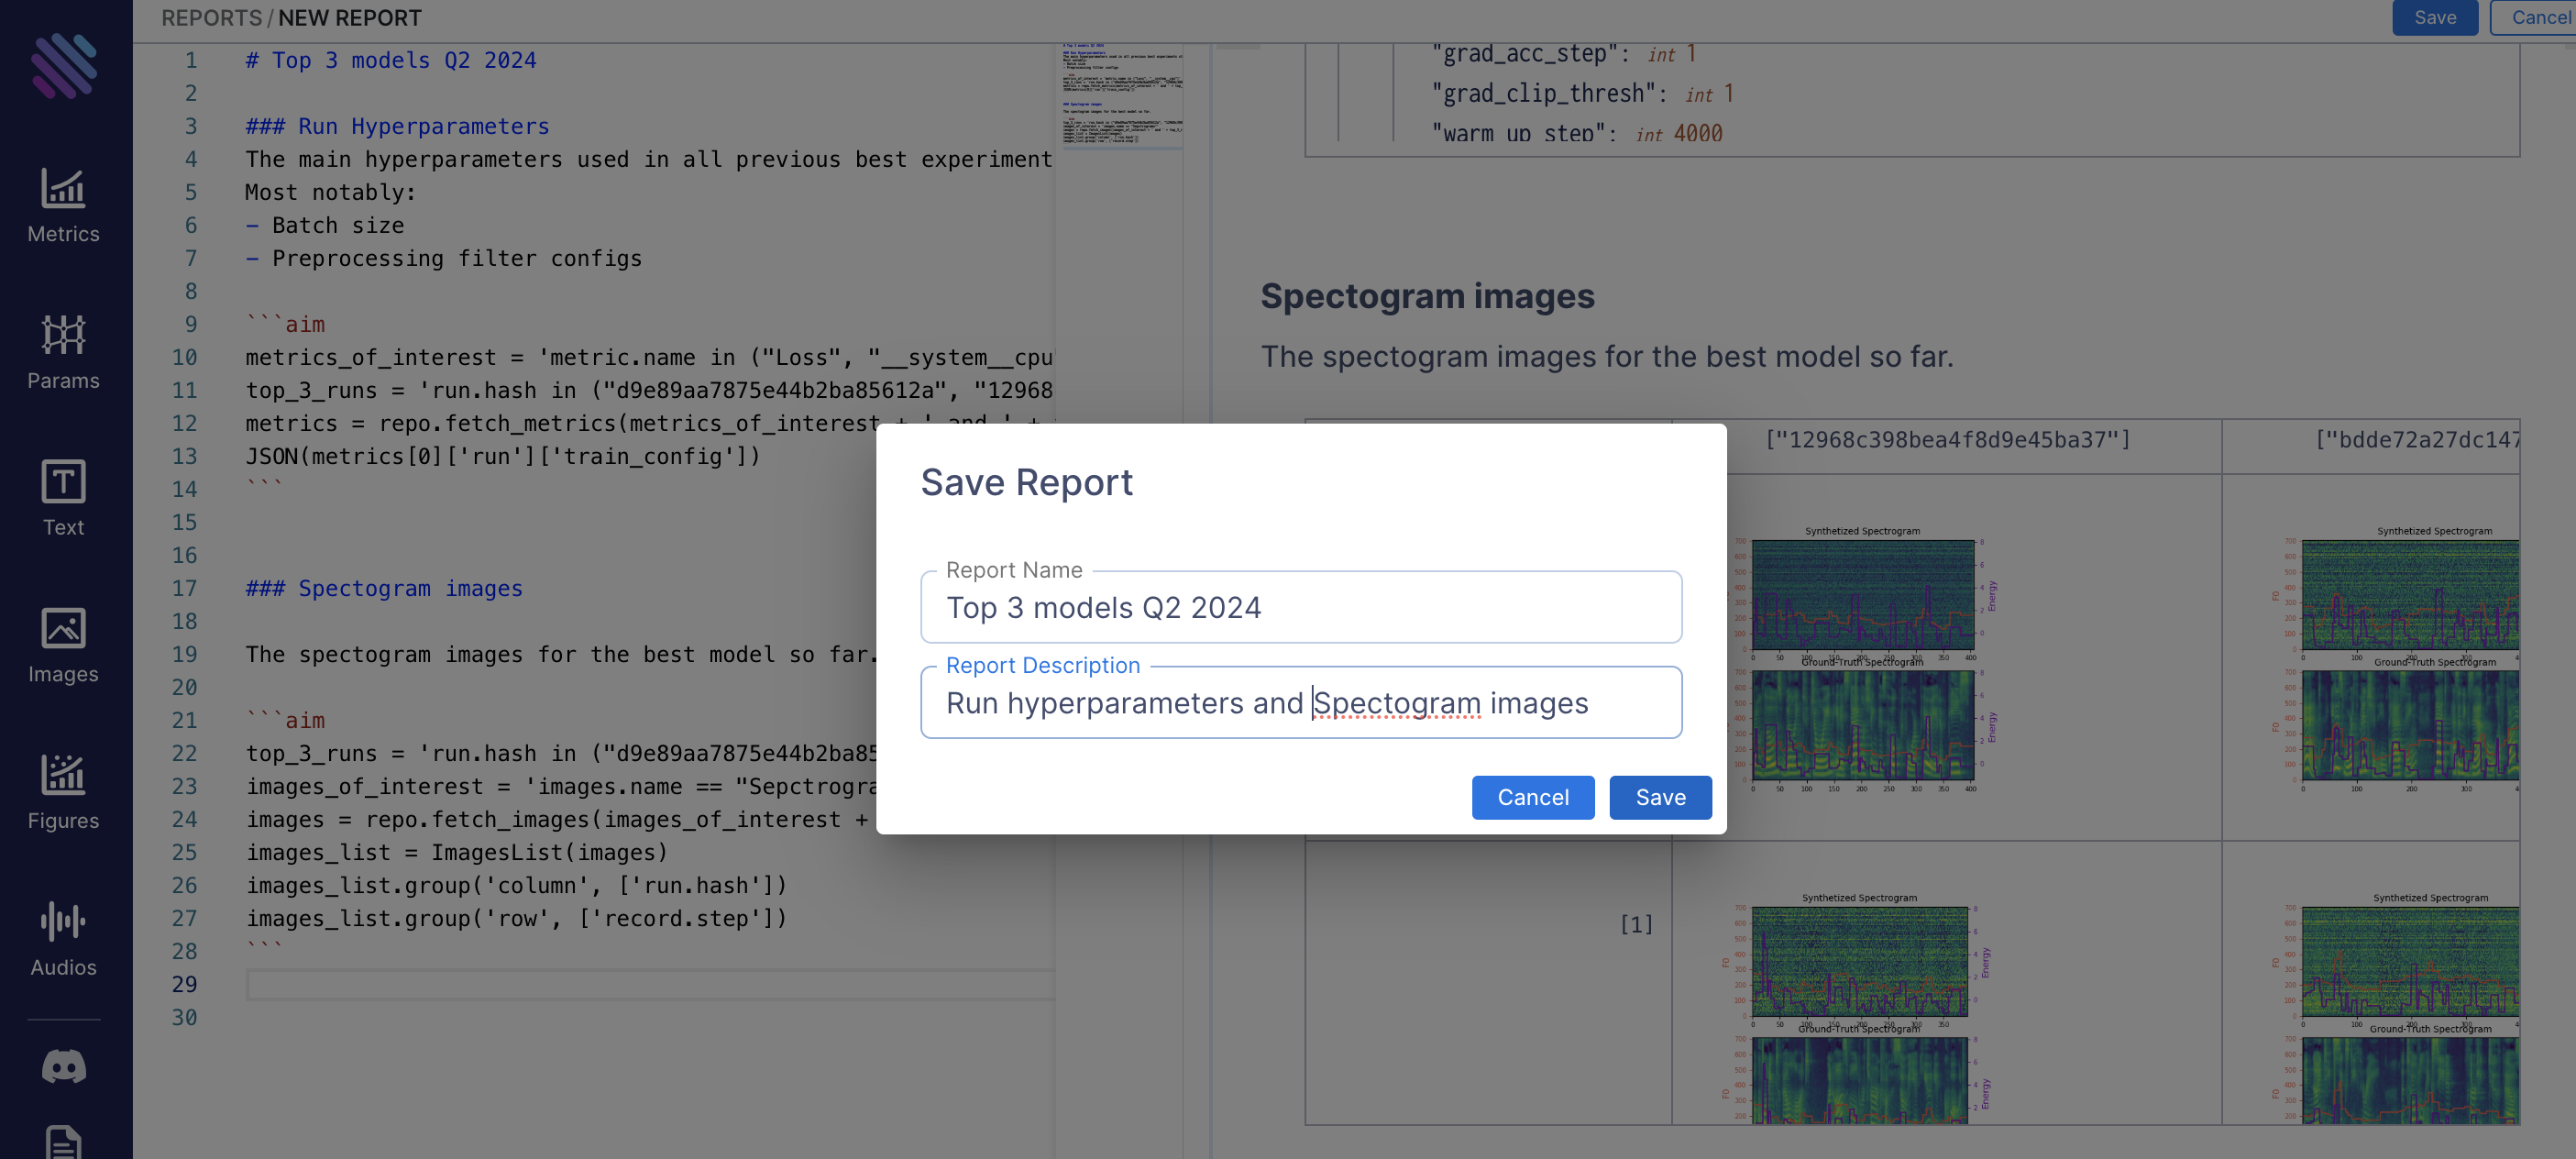
Let’s save our report and add the description:
For more details, check out the documentation.
Full changelog: https://github.com/aimhubio/aim/releases/tag/v3.25.0
Learn More
Aim is on a mission to democratize AI dev tools. 🙌
We have been incredibly lucky to get help and contributions from the amazing Aim community. It’s humbling and inspiring.
Try out Aim, join the Aim community, share your feedback, open issues for new features, bugs.
Don’t forget to leave us a star on GitHub if you think Aim is useful ⭐️.