Feb 16, 2021
Aim basics: using context and subplots to compare validation and test metrics

Researchers divide datasets into three subsets — train, validation and test so they can test their model performance at different levels.
The model is trained on the train subset and subsequent metrics are collected to evaluate how well the training is going. Loss, accuracy and other metrics are computed.
The validation and test sets are used to test the model on additional unseen data to verify how well it generalise.
Models are usually ran on validation subset after each epoch.\ Once the training is done, models are tested on the test subset to verify the final performance and generalisation.
There is a need to collect and effectively compare all these metrics.
Here is how to do that on Aim
Using context to track for different subsets?
Use the aim.track context arguments to pass additional information about the metrics. All context parameters can be used to query, group and do other operations on top of the metrics.
import aim

# train loop
for epoch in range(num_epochs):
  for i, (images, labels) in enumerate(train_loader):
    if i % 30 == 0:
      aim.track(loss.item(), name='loss', epoch=epoch, subset='train')
      aim.track(acc.item(), name='accuracy', epoch=epoch, subset='train')

  # calculate validation metrics at the end of each epoch
  # ...
  aim.track(loss.item(), name='loss', epoch=epoch, subset='val')
  aim.track(acc.item(), name='acc', epoch=epoch, subset='val')
  # ...

  # calculate test metrics
  # ...
  aim.track(loss.item(), name='loss', subset='test')
  aim.track(acc.item(), name='loss', subset='test')
Once the training is ran, execute aim up in your terminal and start the Aim UI.
Using subplots to compare test, val loss and bleu metrics
*Note: The bleu metric is used here instead of accuracy as we are looking at Neural Machine Translation experiments. But this works with every other metric too.*
Let’s go step-by-step on how to break down lots of experiments using subplots.
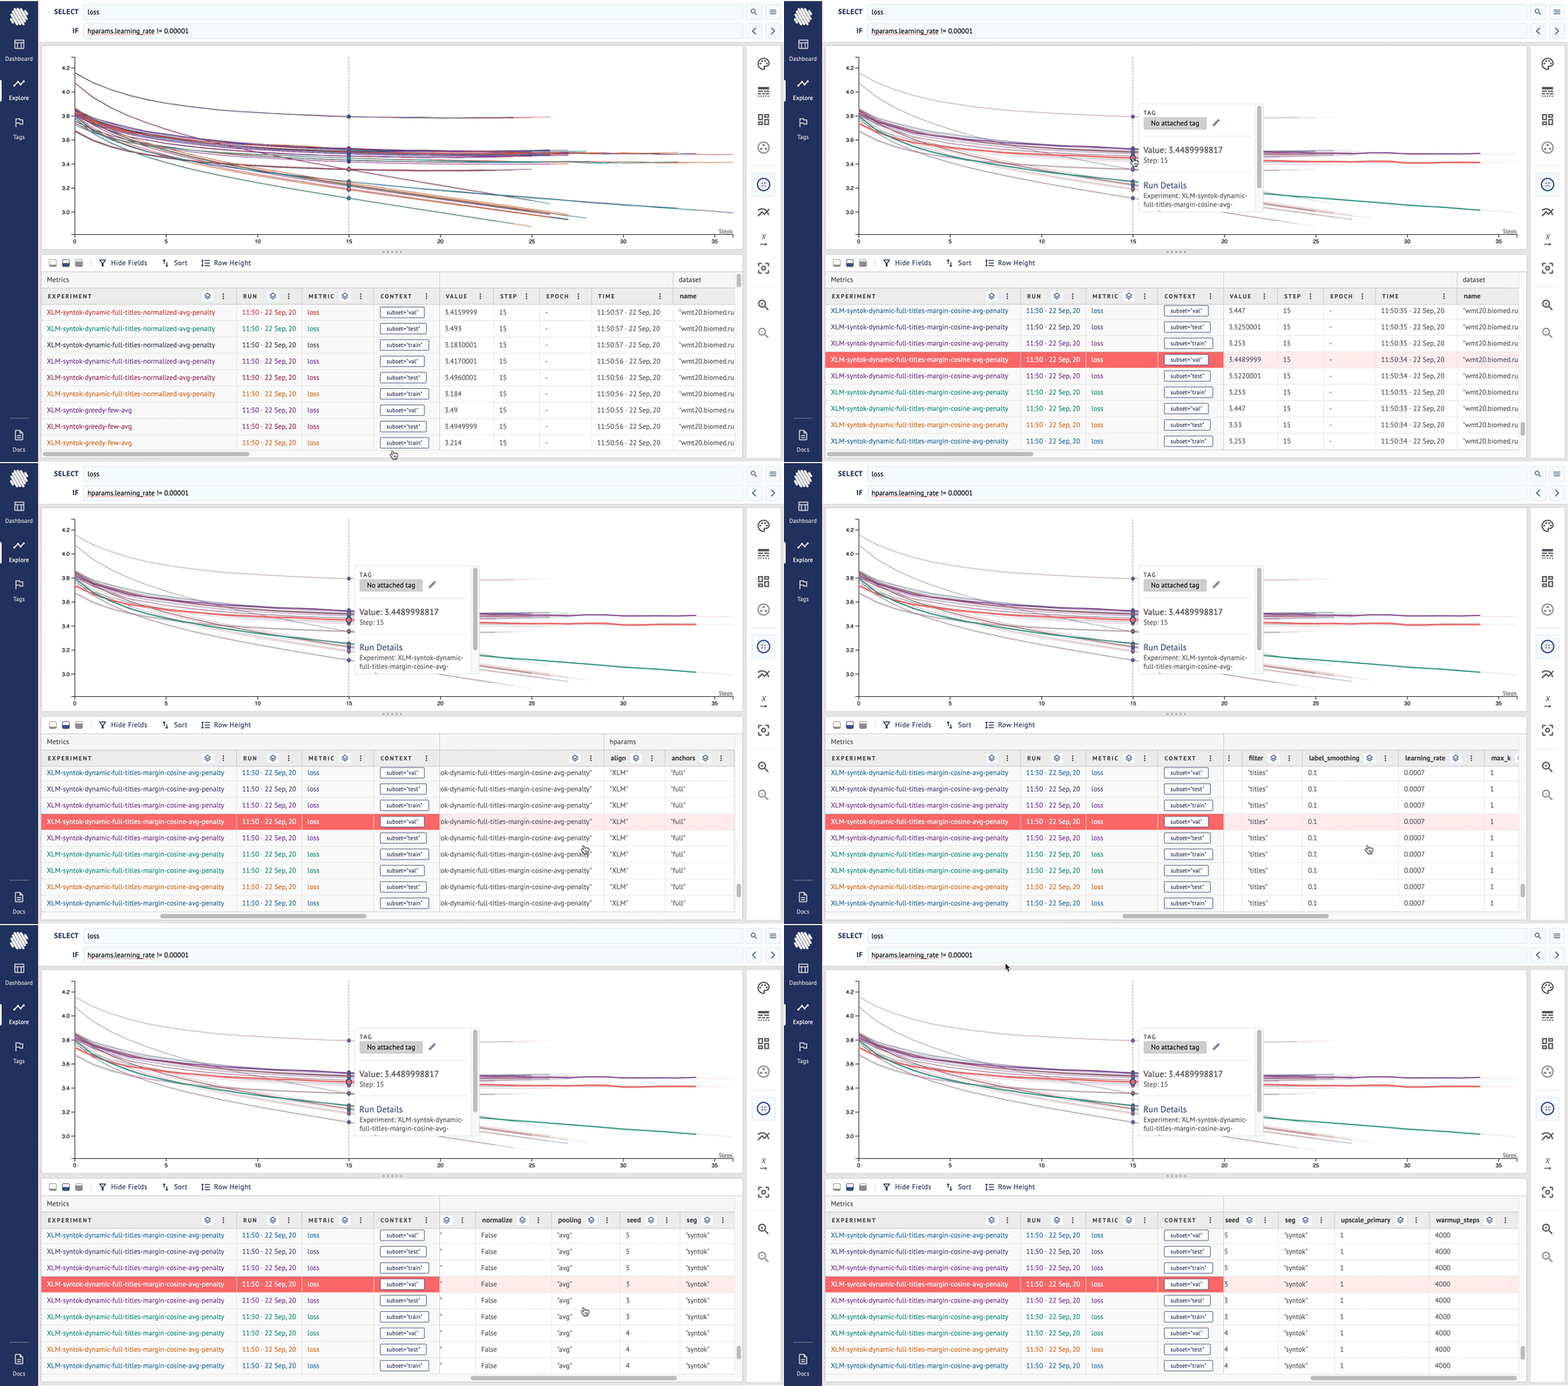
Step 1. Explore the runs, the context table, play with the query language.

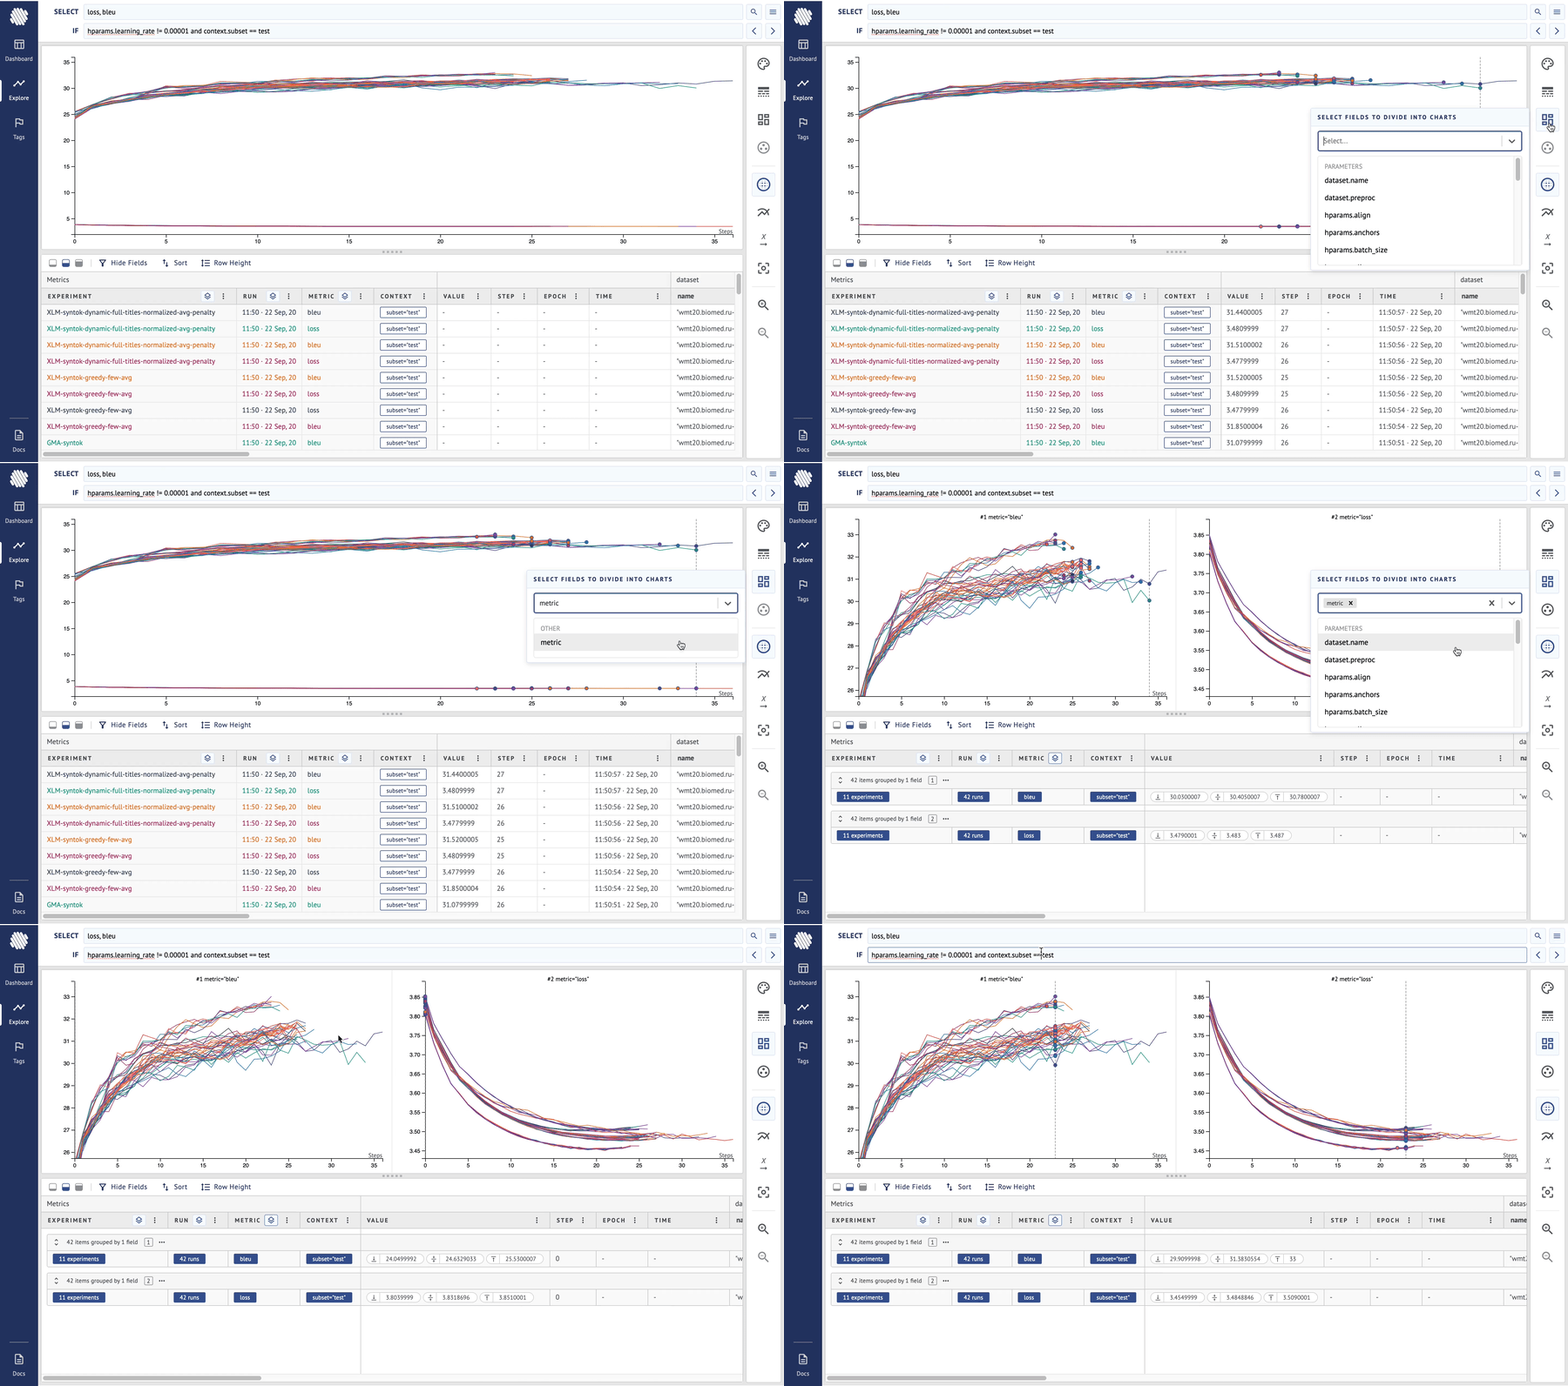
Step 2. Add the bleu metric to the Select input — query both metrics at the same time. Divide into subplots by metric.

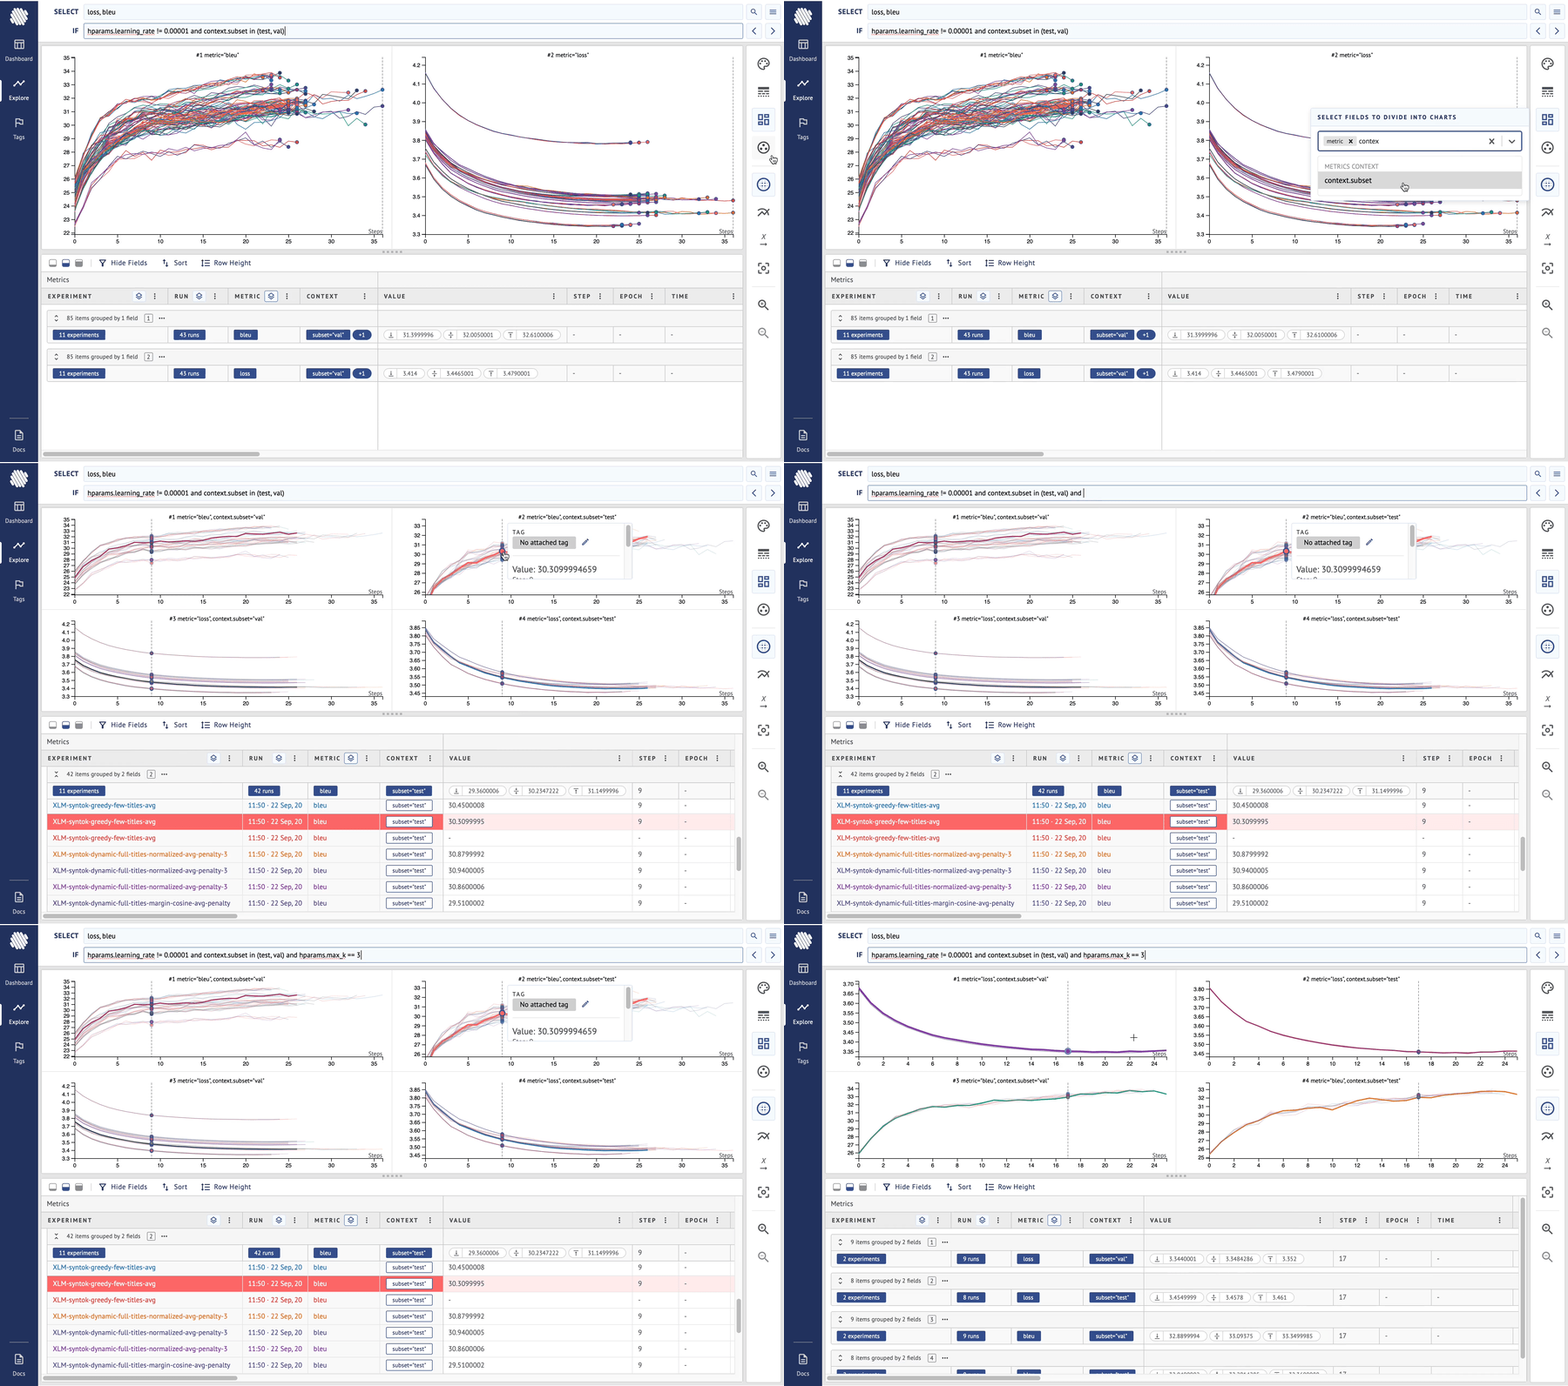
Step 3. Search by context.subset to show both test and val loss and bleu metrics. Divide into subplots further by context.subset too so Aim UI shows test and val metrics on different subplots for better comparison.

Not it’s easy and straightforward to simultaneously compare both 4 metrics and find the best version of the model.
Summary
Here is a full summary video on how to do it on the UI.
Learn More
If you find Aim useful, support us and star the project on GitHub. Join the Aim community and share more about your use-cases and how we can improve Aim to suit them.