Aim Release — Activity View and X-axis alignment
Aim v1.3.5 is now available. Thanks to the incredible Aim community for the feedback and support on building democratized open source AI dev tools.
Check out the new features at play.aimstack.io
Here are the highlights of the features:
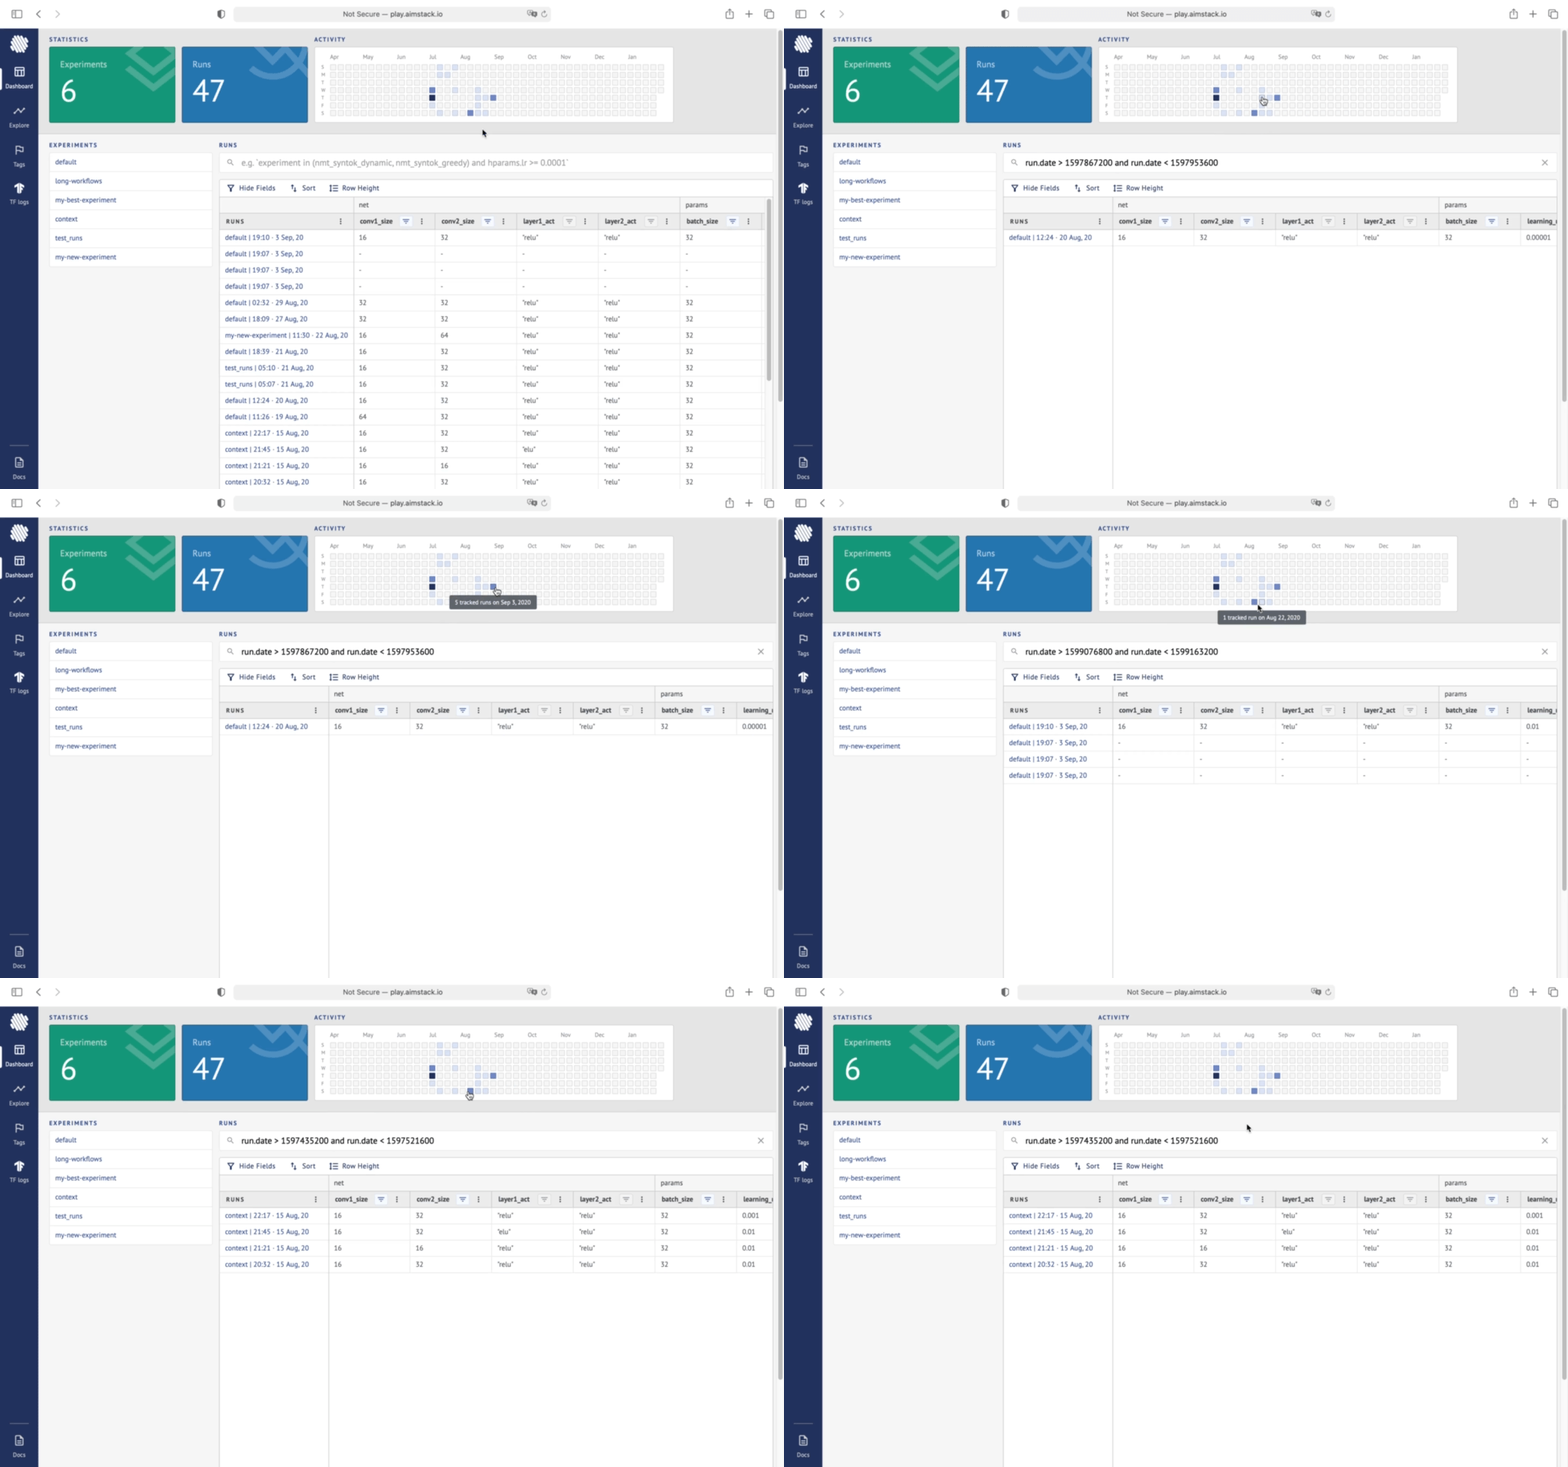
Activity View on the Dashboard
The Activity View shows the daily experiment runs. With one click you can search each day’s runs and explore them straight away
Statistics displays the overall count of Experiments and Runs.

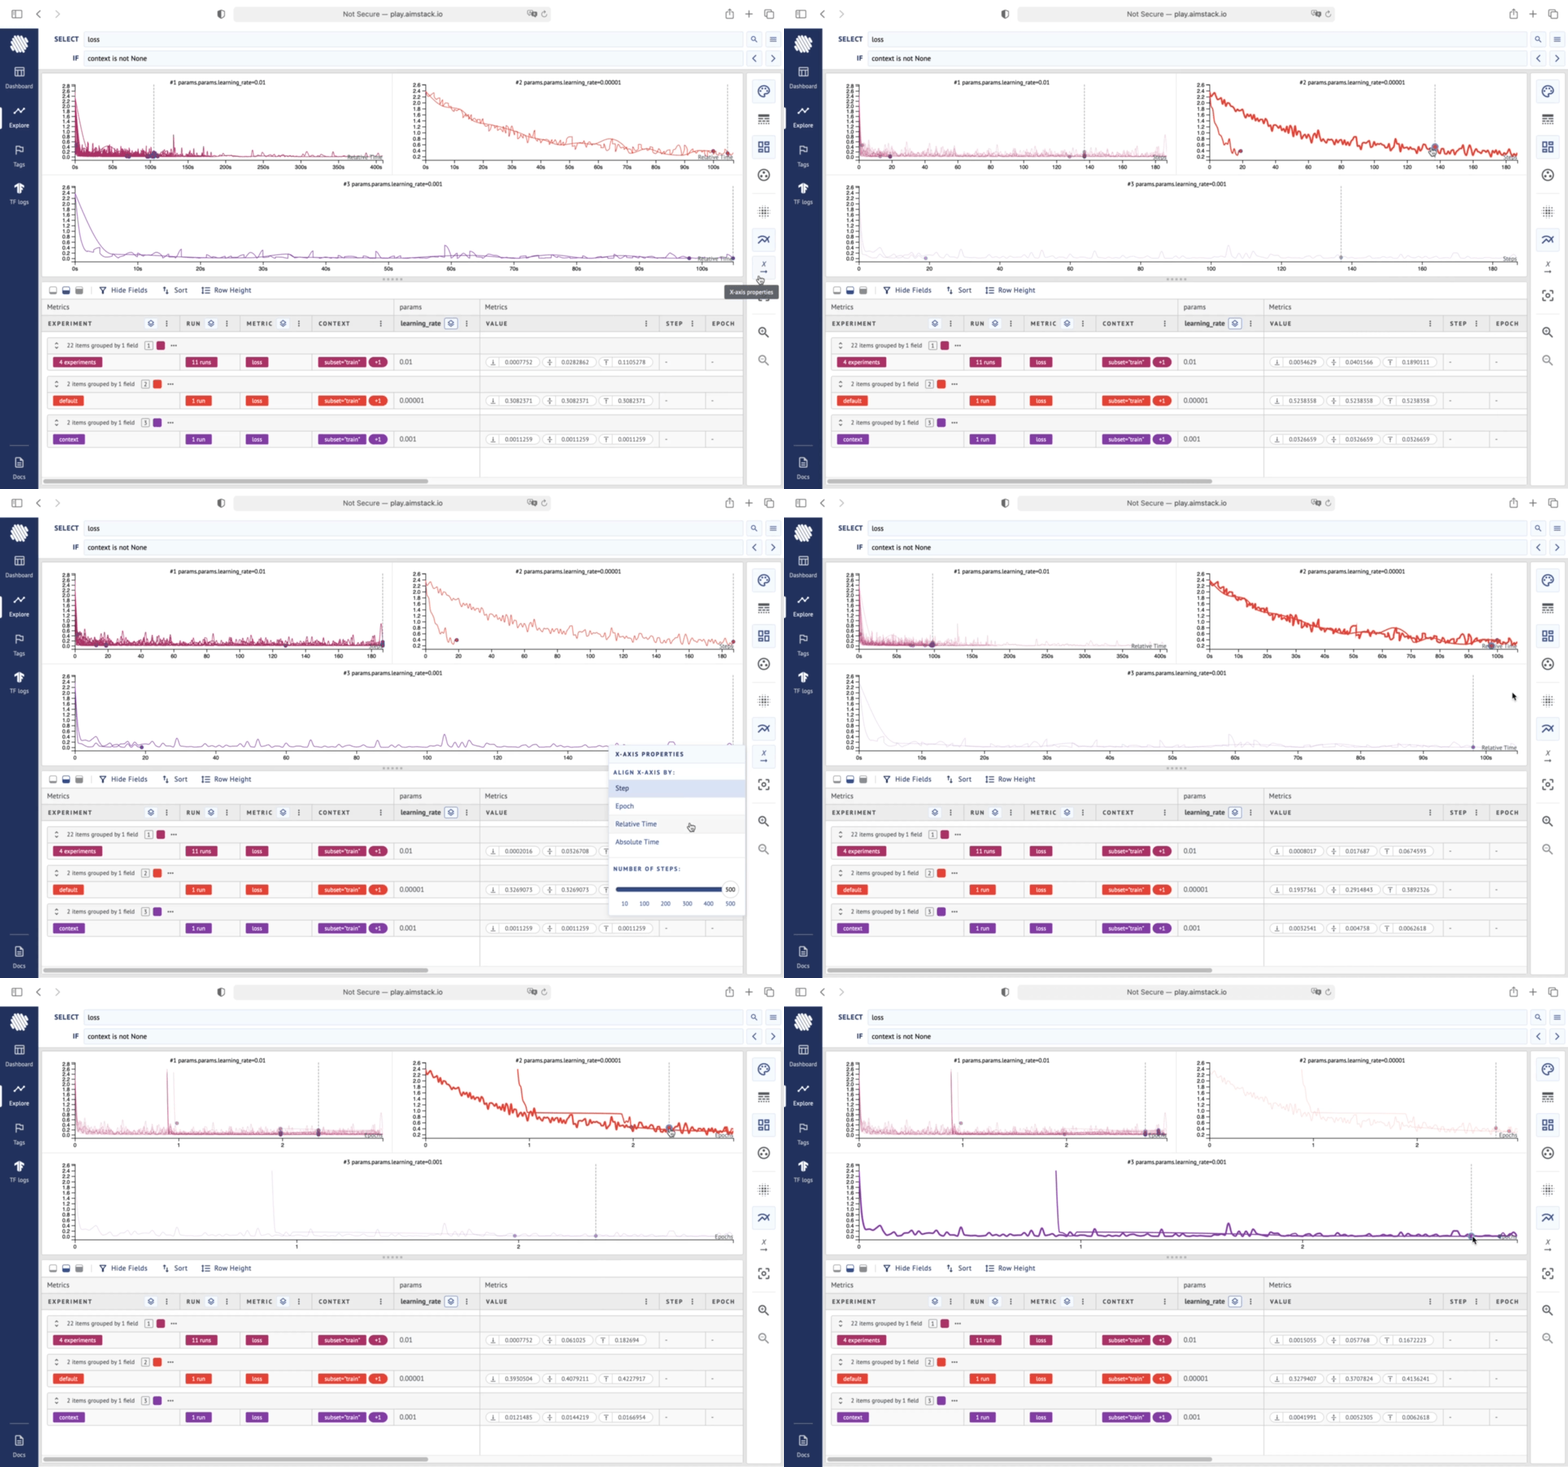
X-axis alignment by epoch
X-axis alignment adds another layer of superpower for metric comparison. If you have tracked metrics in different time-frequencies (e.g. train loss — 1000 steps, validation loss — 15 steps) then you can align them by epoch, relative time or absolute time.

Ordering runs both on Explore and on Dashboard
Now you can order runs both on the Dashboard and on the Explore. Sort the runs by a hyperparam value of metric value on dashboard and explore.
On Explore, when sorted by a hyperparam that’s also used for dividing into subplots, the subplots will be positioned by the hyperparam value too.

Learn More
We have been working on Aim for the past 6 months and excited to see this much interest from the community.
We are working tirelessly for adding new community-driven features to Aim (and those features have been doubling every month 😊). Try out Aim, join the Aim community, share your feedback.
And don’t forget to leave Aim a star on GitHub for support 🙌.