Metric as an alternative x-axis
Sometimes when comparing the metrics, it’s not enough to just put them into perspective via subplots.
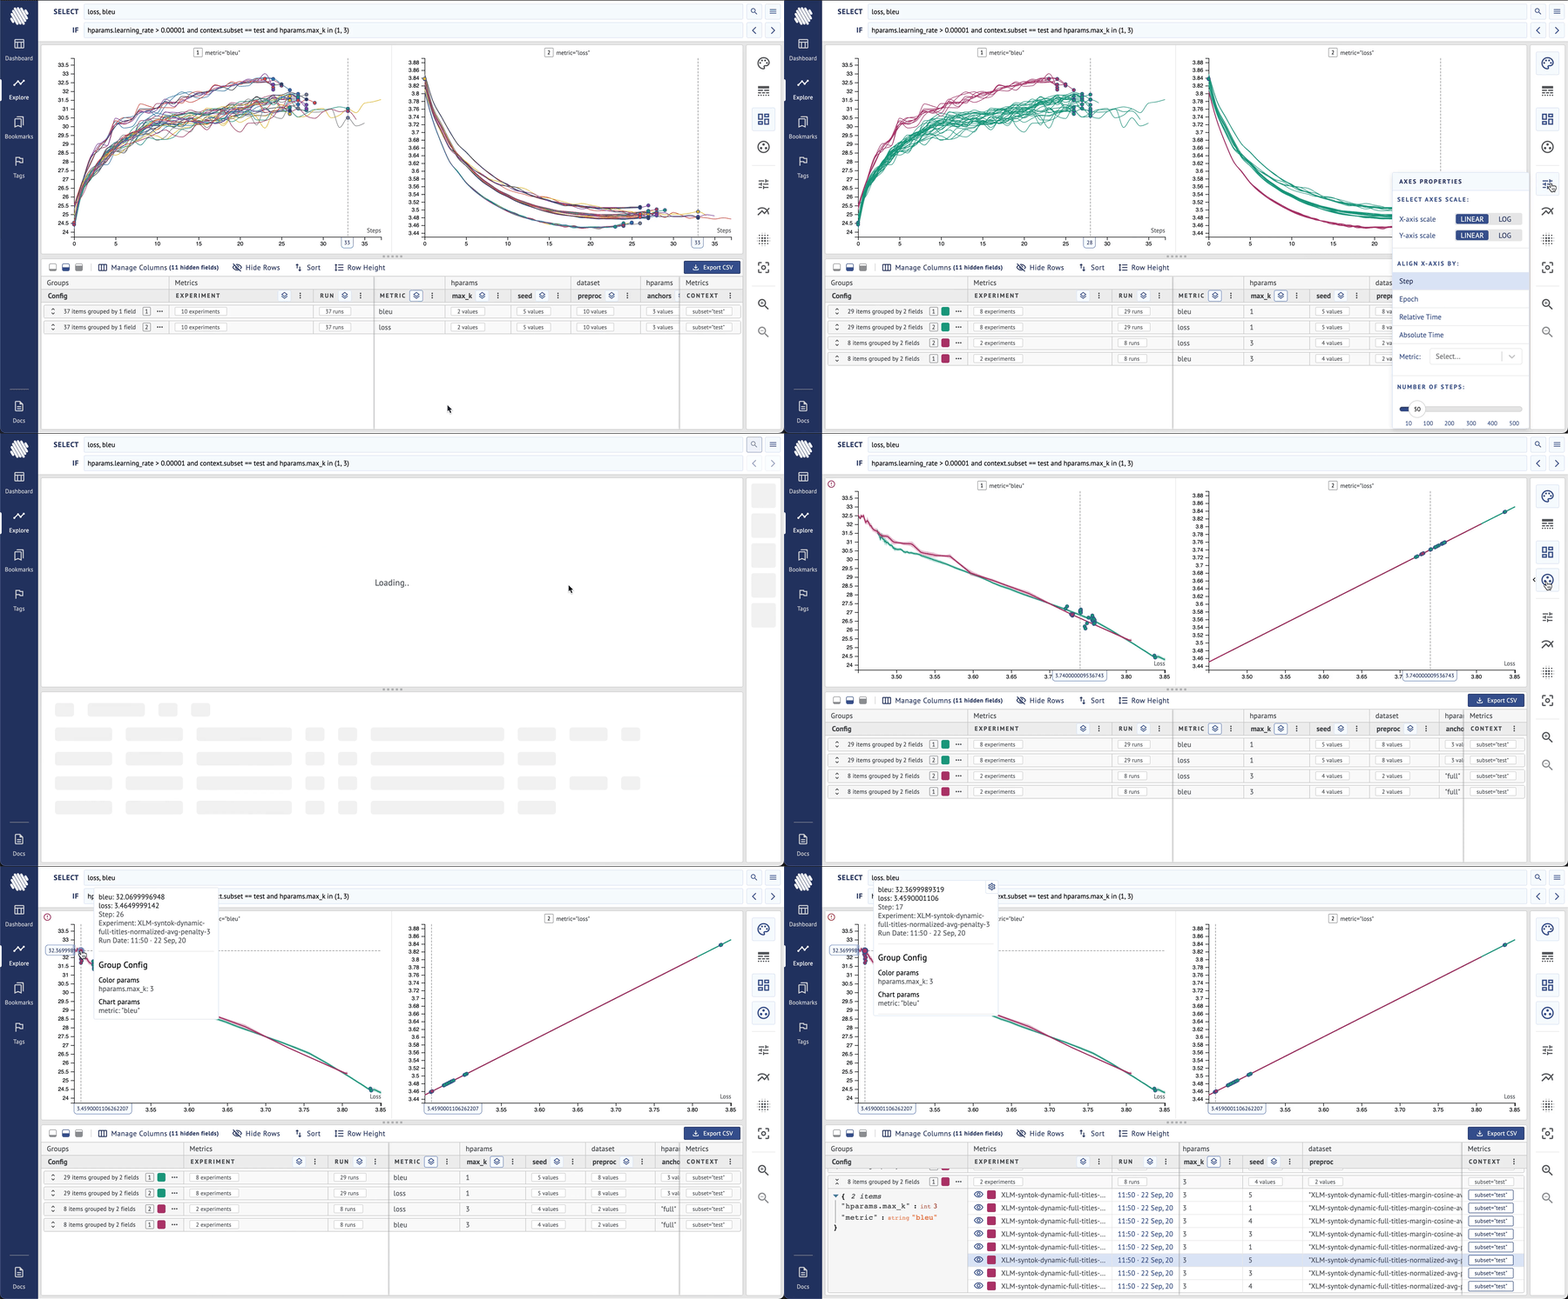
For instance in the quick demo below, we are looking at a Neural Machine Translation (NMT) problem where two metrics are being compared — loss andbleu. One of the main indicators of a performant model in NMT, is when higher values of bleu correlates with the lower values of loss.
Just plotting them besides each other sometimes isn’t enough to see how they correlate. In this case we use loss as the x-axis to directly see the correlation between the lossand thebleu metrics for two groups of runs ( max_k==3and max_k == 1).

Using a different metric as the x-axis helps to see the correlation between two metrics of training runs better.
Note: if the metric is not increasing monotonously, its values re-order. Then they set as the x-axis (see in case of the loss).
Learn More
Aim is on a mission to democratize AI dev tools.
We have been incredibly lucky to get help and contributions from the amazing Aim community. It’s humbling and inspiring.
Try out Aim, join the Aim community, share your feedback, open issues for new features, bugs.
And don’t forget to leave Aim a star on GitHub for support.