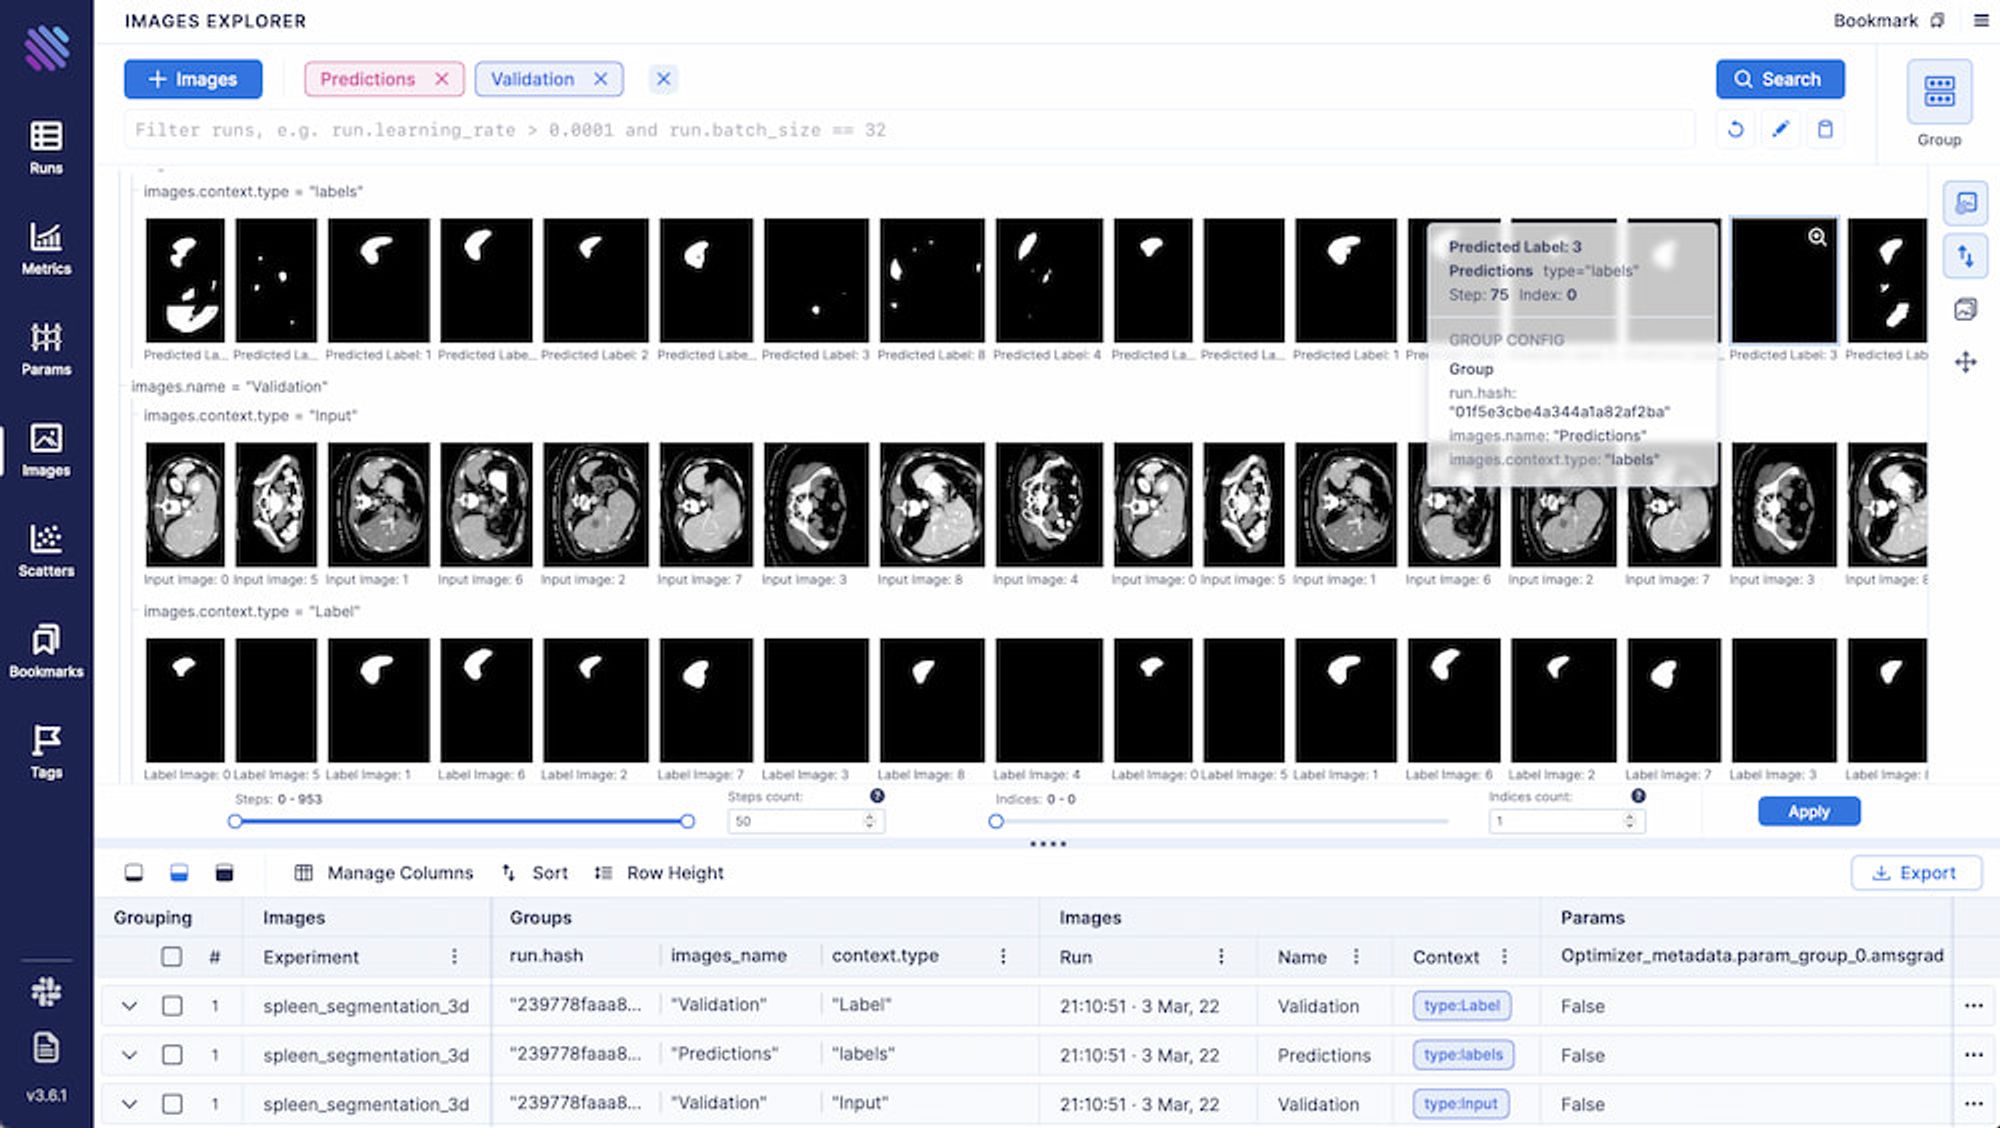
In this tutorial we will show how to use Aim and MONAI for 3d Spleen segmentation on a medical dataset from http://medicaldecathlon.com/.
This is a longer form of the 3D spleen segmentation tutorial on the MONAI tutorials repo.
For a complete in-depth overview of the code and the methodology please follow this tutorial directly or our very own Aim from Zero to Hero tutorial.
Tracking the basics
As we are dealing with an application in a BioMedical domain, we would like to be able to track all possible transformations, hyperparameters and architectural metadata. We need the latter to analyze our model and results with a greater level of granularity.
Transformations Matter
The way we preprocess and augment the data has massive implications for the robustness of the eventual model. Thus carefully tracking and filtering through the transformations is obligatory. Aim helps us to seamlessly integrate this into the experiment through theSingle Run Page.
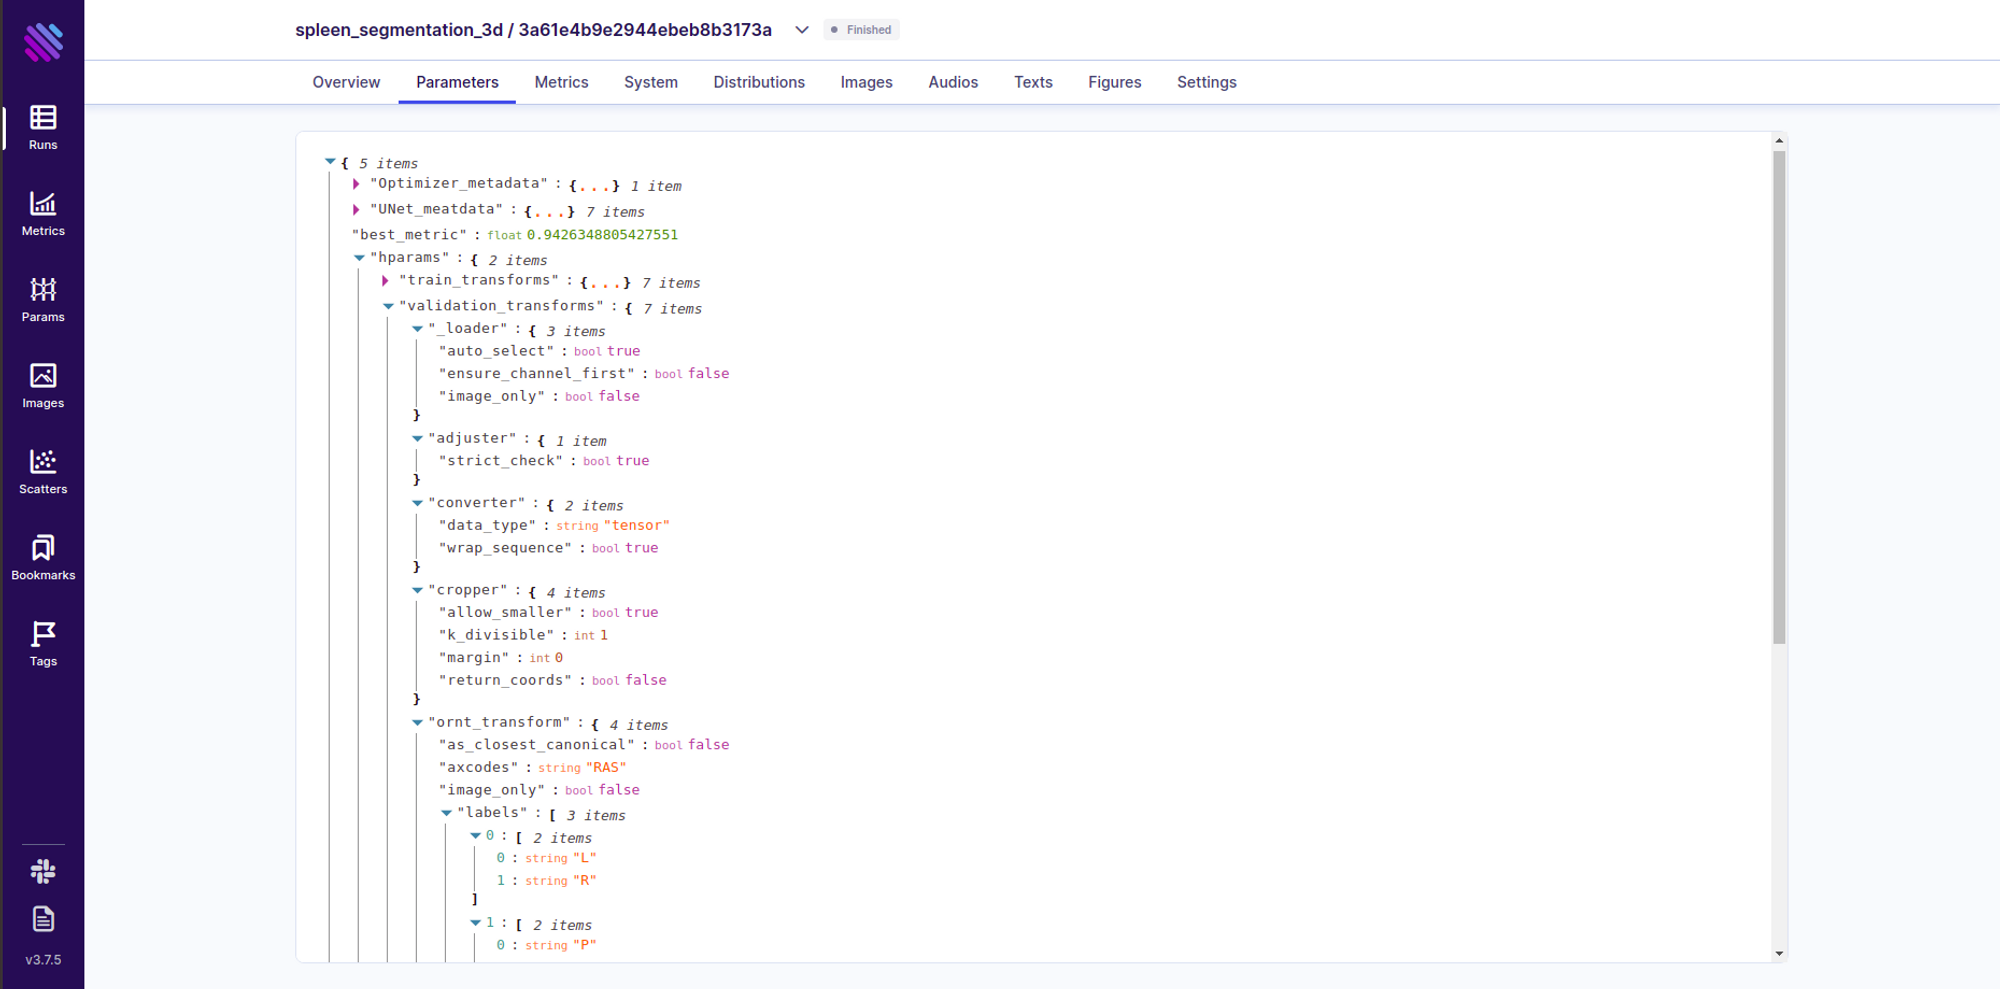
You can further search/filter through the runs based on these transformations using Aims’ very own pythonic search language AimQL. An Advanced usage looks like this

Lets talk about models and optimizers
Similar to the augmentations, tracking the architectural and optimization choices during model creation can be essential for analyzing further feasibility and the outcome of the experiment. It is seamless to track; as long the (hyper)parameters conform to a pythonic dict-like object, you can incorporate it within the trackables and enjoy the complete searchability functional fromAimQL
aim_run  = aim.Run(experiment = 'some experiment name')

aim_run['hparams'] = tansformations_dict_train
...
UNet_meatdata = dict(spatial_dims=3,
    in_channels=1,
    out_channels=2,
    channels=(16, 32, 64, 128, 256),
    strides=(2, 2, 2, 2),
    num_res_units=2,
    norm=Norm.BATCH)

aim_run['UNet_meatdata'] = UNet_meatdata

...

aim_run['Optimizer_metadata'] = Optimizer_metadata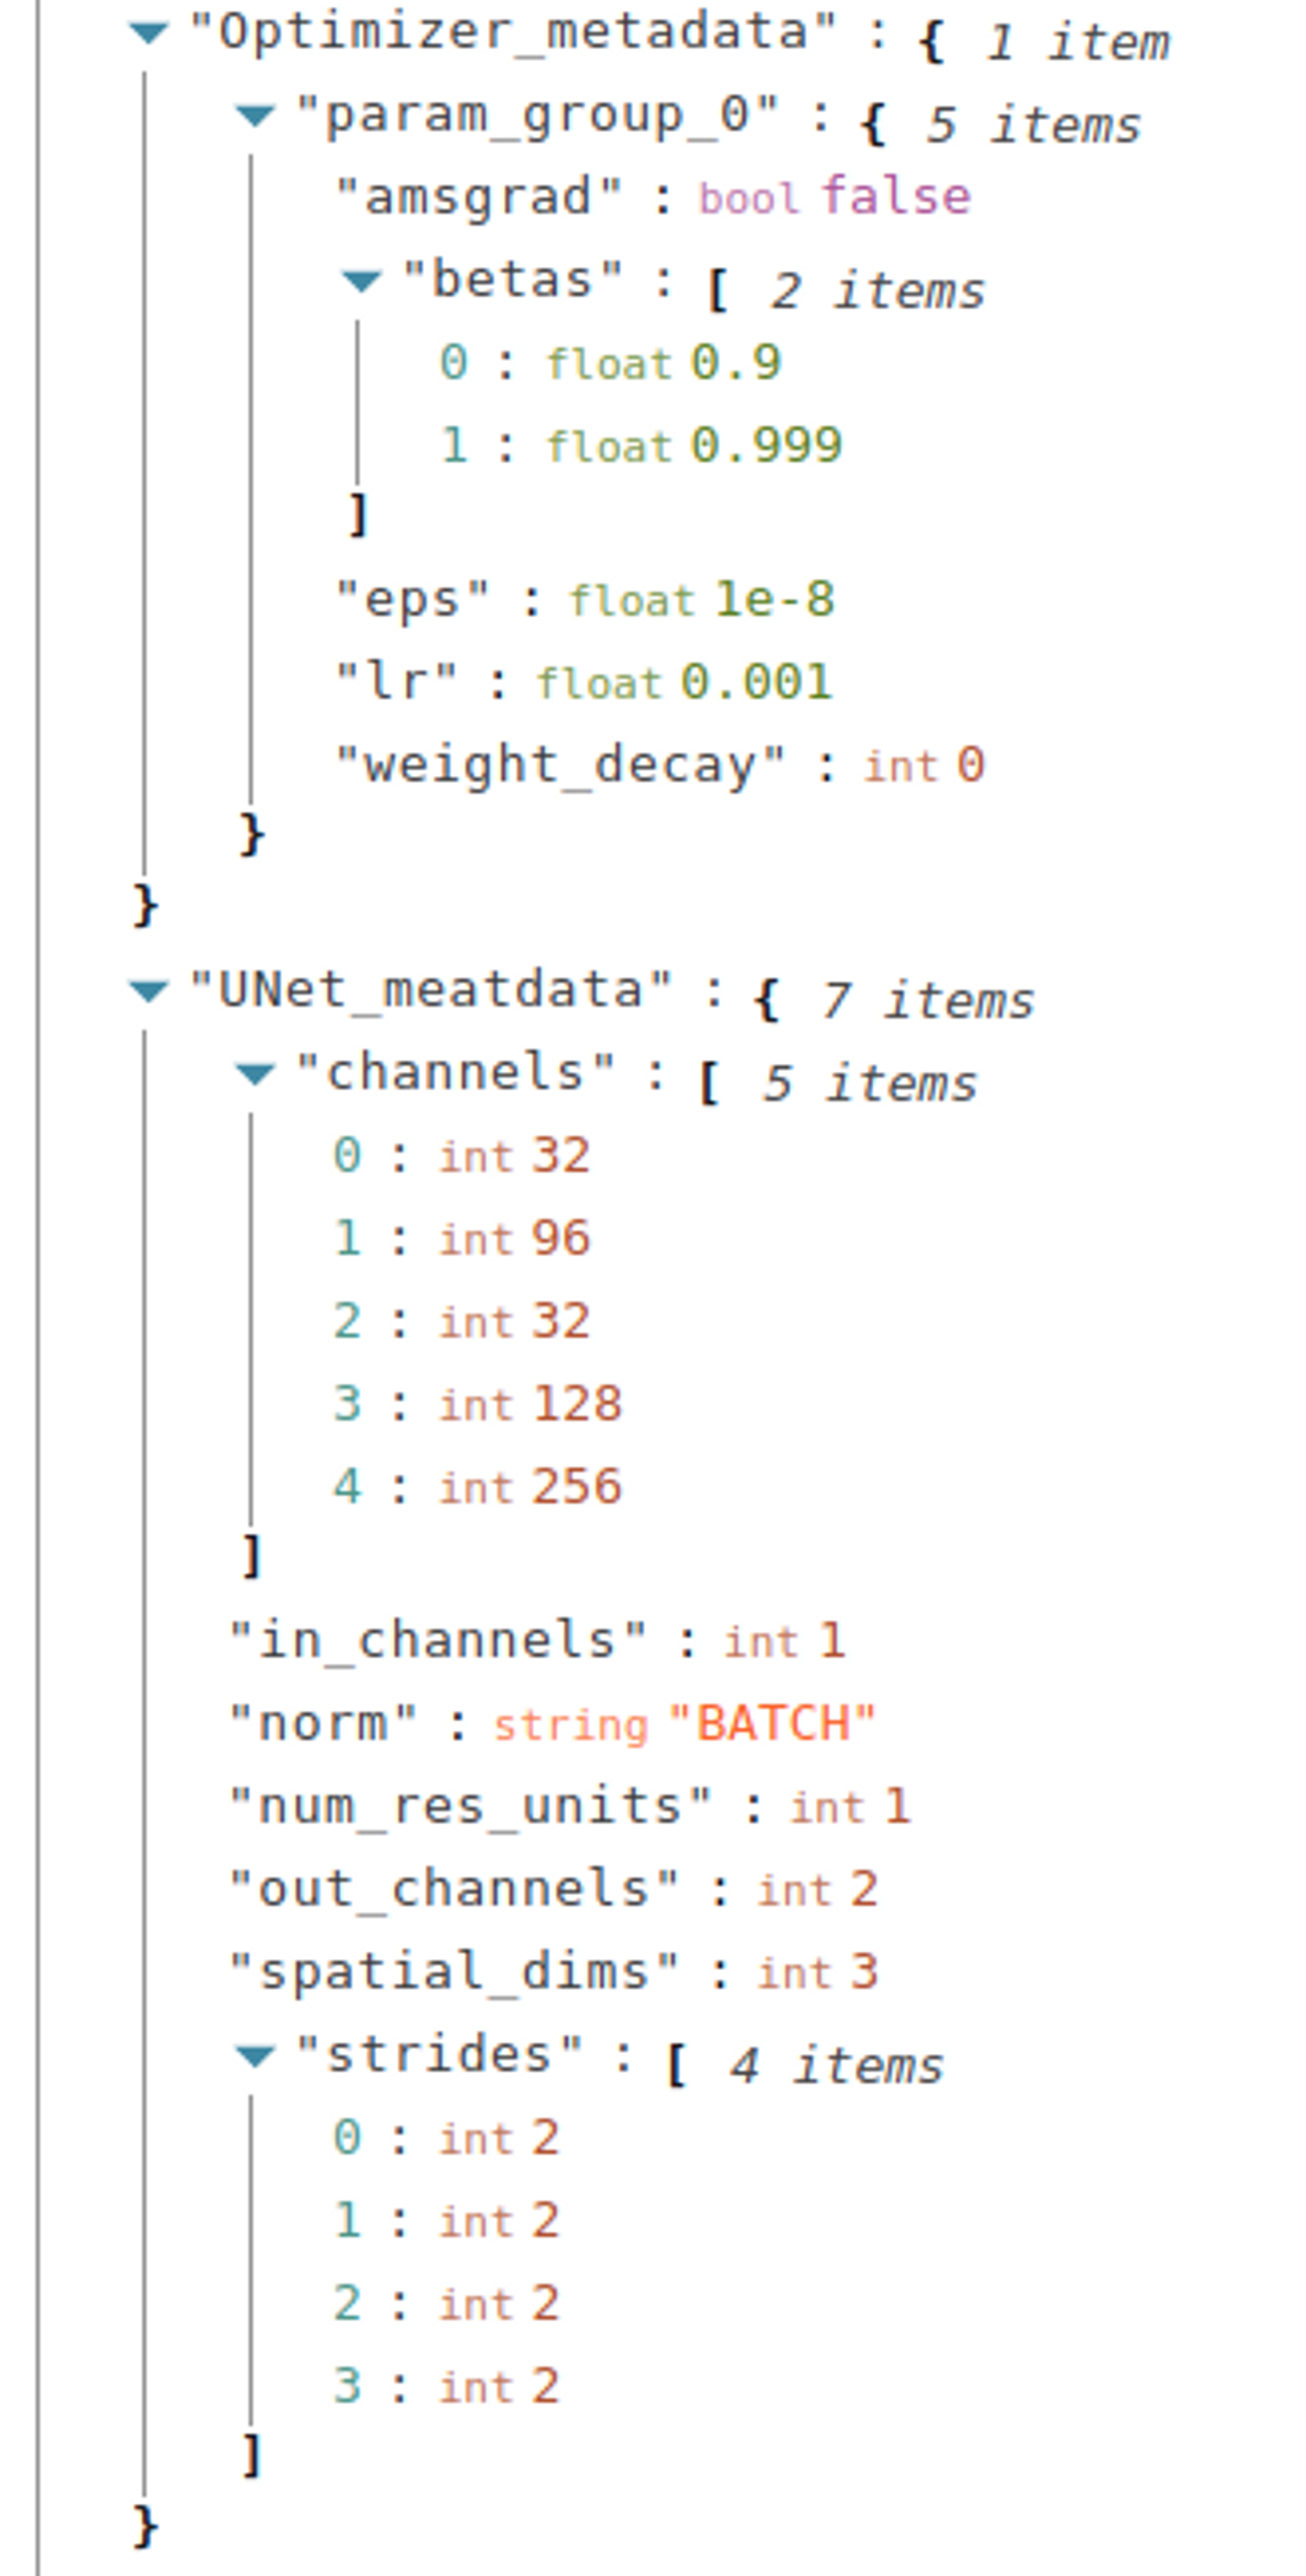
What about Losses?
Majority of people working within the machine learning landscape have tried to optimize a certain type of metric/Loss w.r.t. the formulation of their task. Gone are the days when you need to simply look at the numbers within the logs or plot the losses post-training with matplotlib. Aim allows for simple tracking of such losses (The ease of integration and use is an inherent theme).
Furthermore, a natural question would be, what if we have numerous experiments with a variety of losses and metrics to track. Aim has you covered here with the ease of tracking and grouping. Tracking a set of varying losses can be completed in this fashion
aim_run  = aim.Run(experiment = 'some experiment name')

#Some Preprocessing
...

# Training Pipeline
for batch in batches:
    ...
    loss_1 = some_loss(...)
    loss_2 = some_loss(...)
    metric_1 = some_metric(...)

    aim_run.track(loss_1 , name = "Loss_name", context = {'type':'loss_type'})
    aim_run.track(loss_2 , name = "Loss_name", context = {'type':'loss_type'})
    aim_run.track(metric_1 , name = "Metric_name", context = {'type':'metric_type'}
After grouping, we end up with a visualization akin to this.
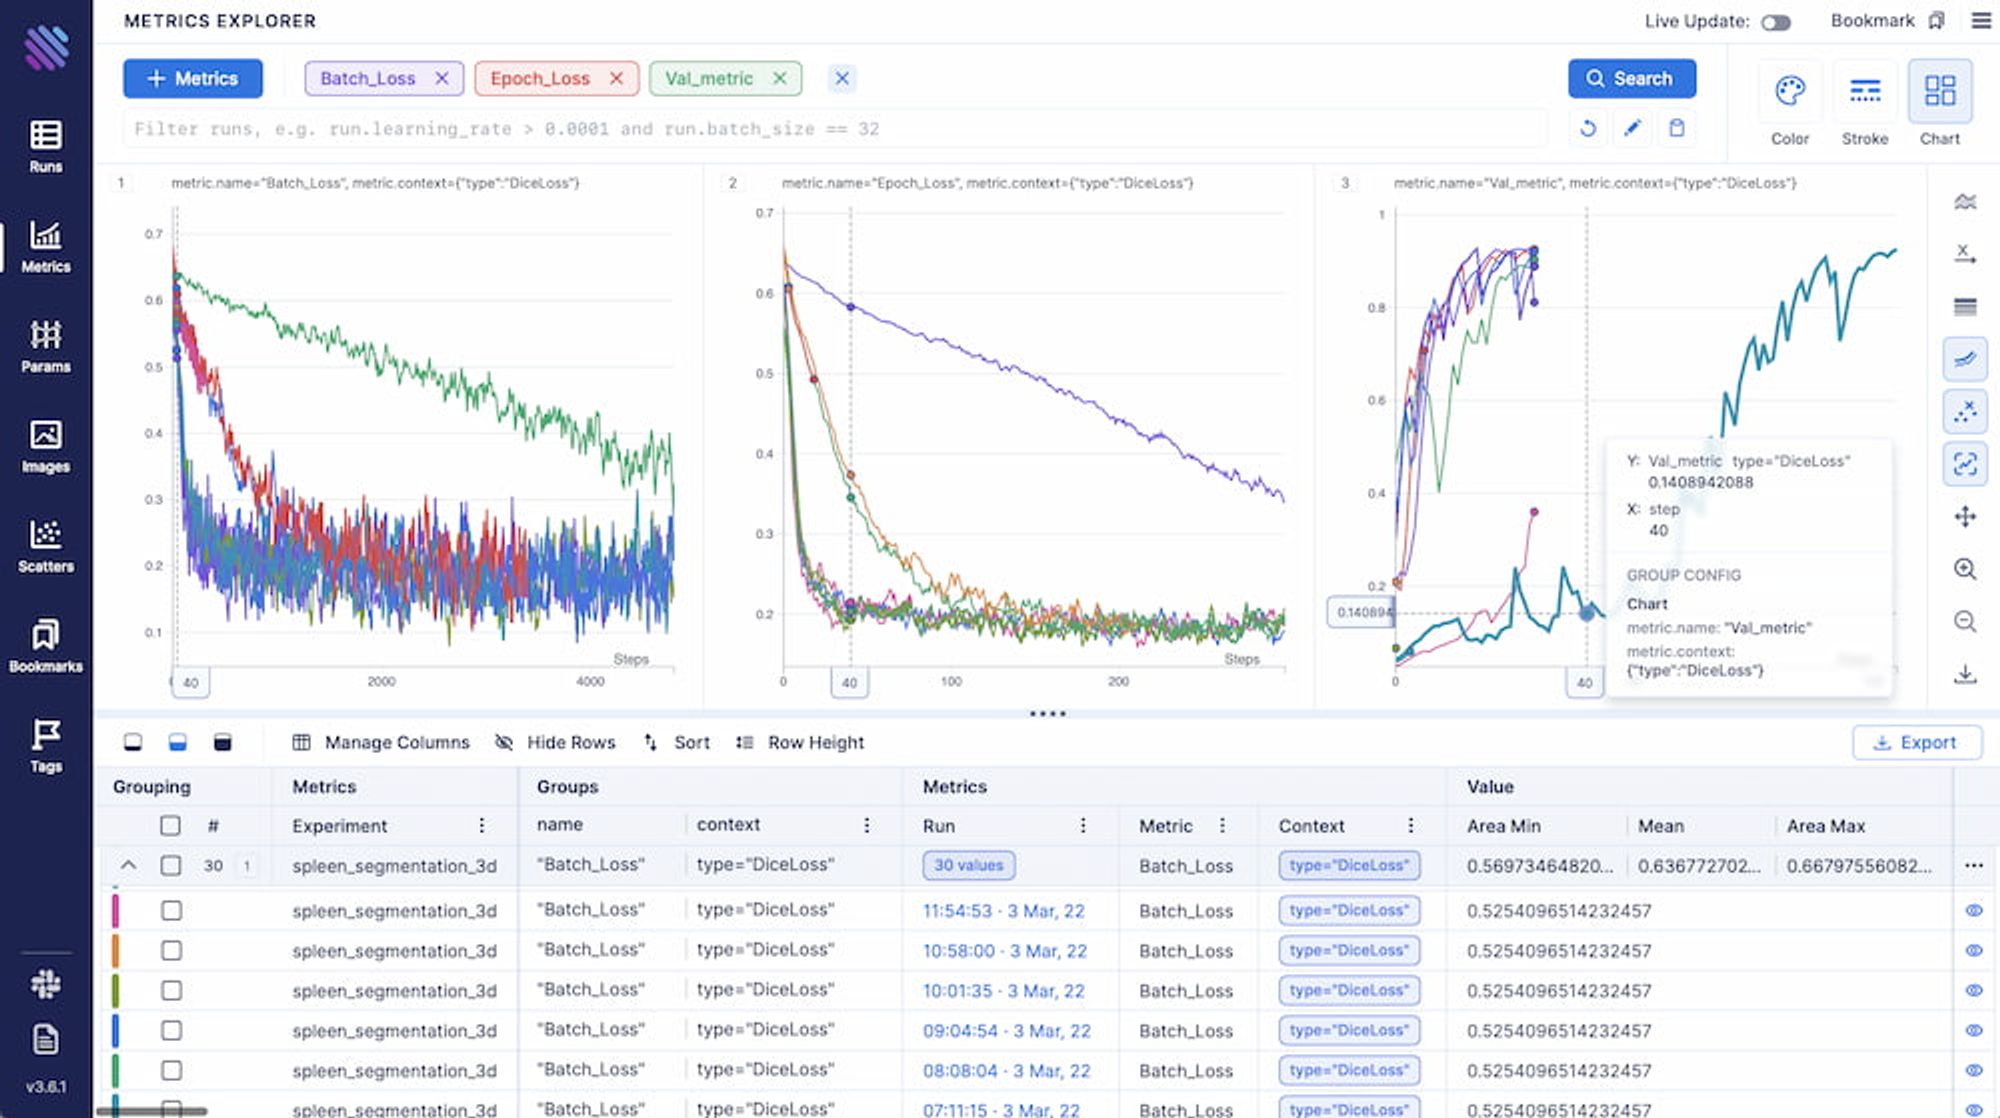
Aggregating, grouping, decoupling and customizing the way you want to visualise your experimental metrics is rather intuitive. You can also view the complete documentation or simply play around in our interactive Demo.
A picture is worth a thousand words
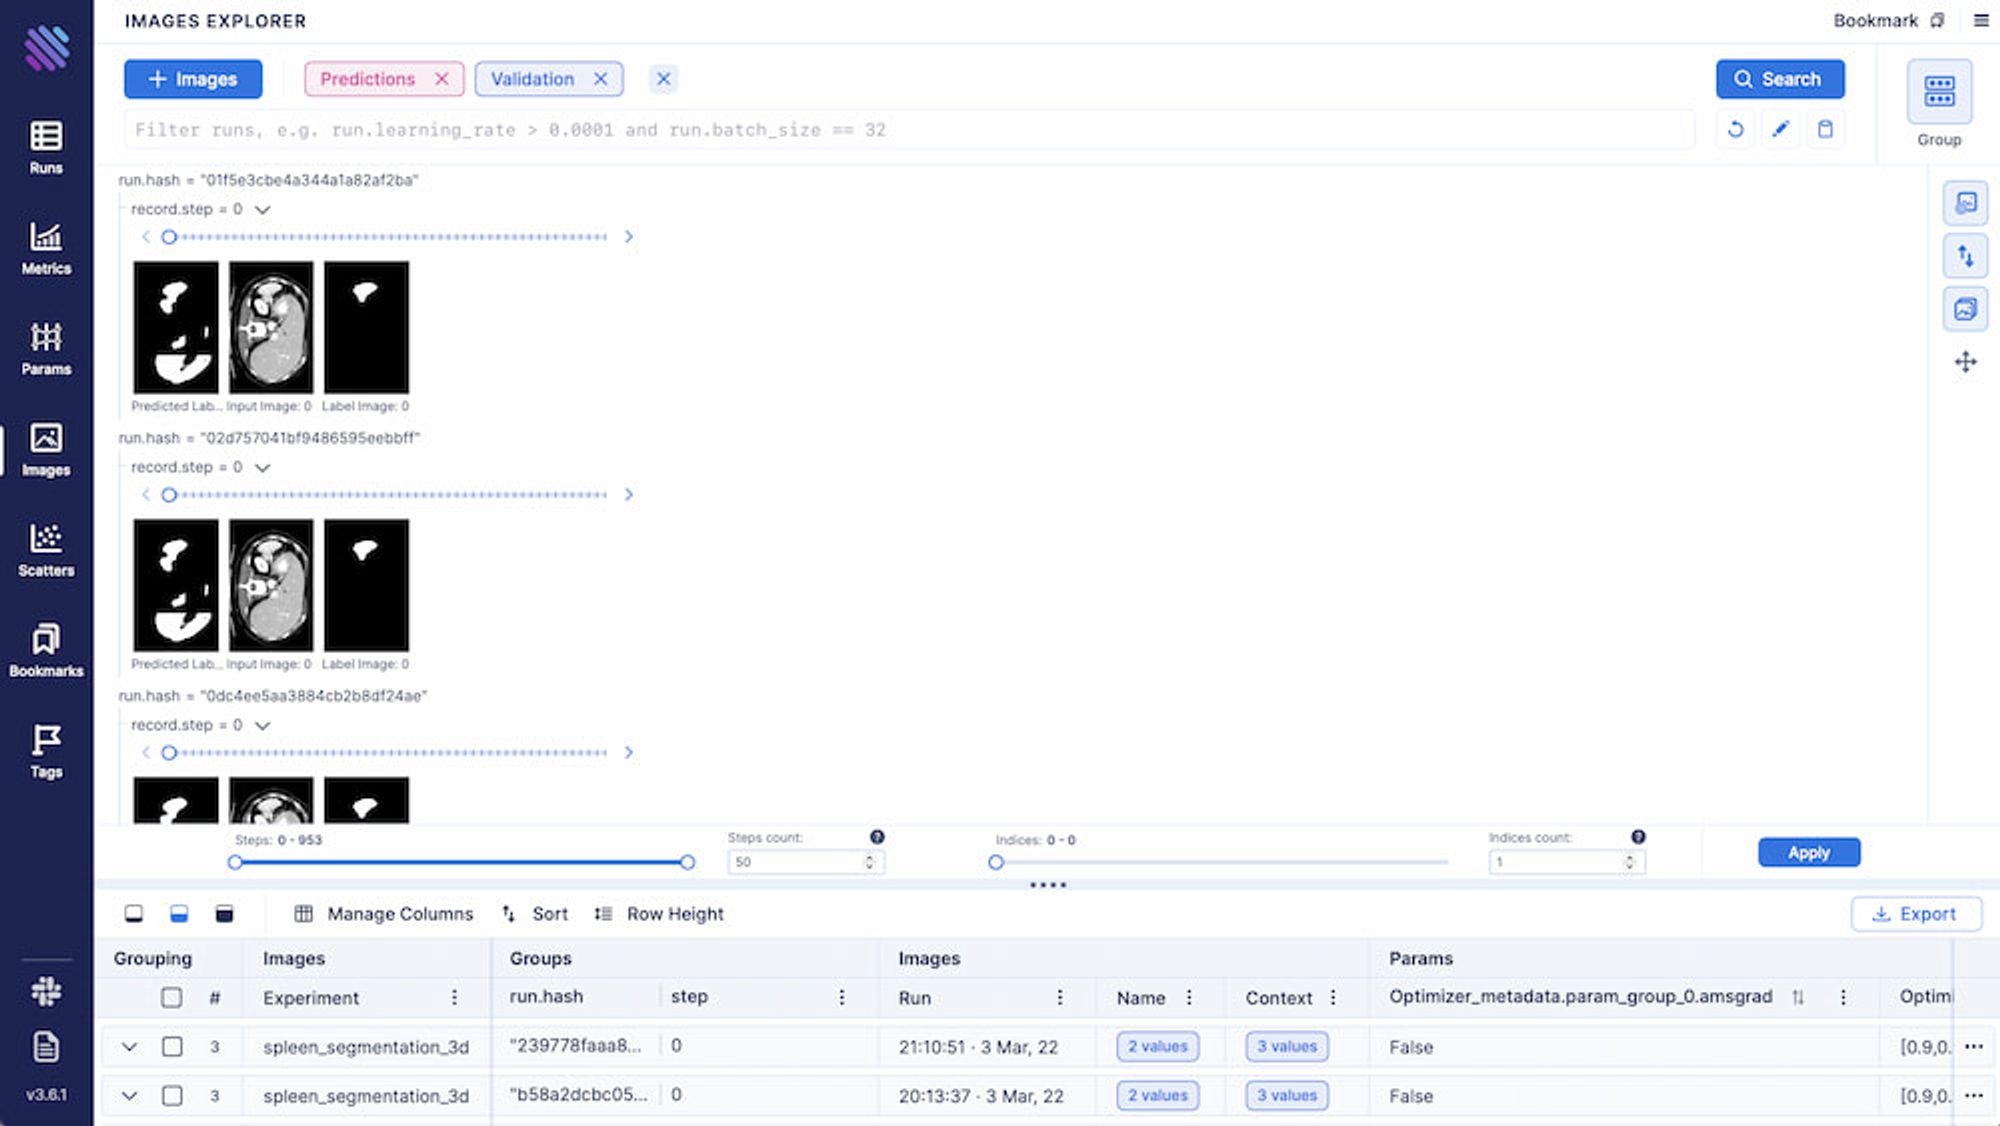
In the context of BioMedical Imaging, particularly 3D spleen segmentation, we would like to be able to view how does the model improve over the training iterations. Previously this would have been a challenging task, however, we came up with a rather neat solution at Aim. You can track images as easily as losses using our framework, meaning the predictions masks on the validation set can be tracked per slice of the 3D segmentation task.
aim_run.track(aim.Image(val_inputs[0, 0, :, :, slice_to_track], \
                        caption=f'Input Image: {index}'), \
                name = 'Validation',  context = {'type':'Input'})

aim_run.track(aim.Image(val_labels[0, 0, :, :, slice_to_track], \
                        caption=f'Label Image: {index}'), \
                name = 'Validation',  context = {'type':'Label'})
aim_run.track(aim.Image(output,caption=f'Predicted Label: {index}'), \
                name = 'Predictions',  context = {'type':'labels'})
All the grouping/filtering/aggregation functional presented above are also available for Images.

A figure is worth a thousand pictures
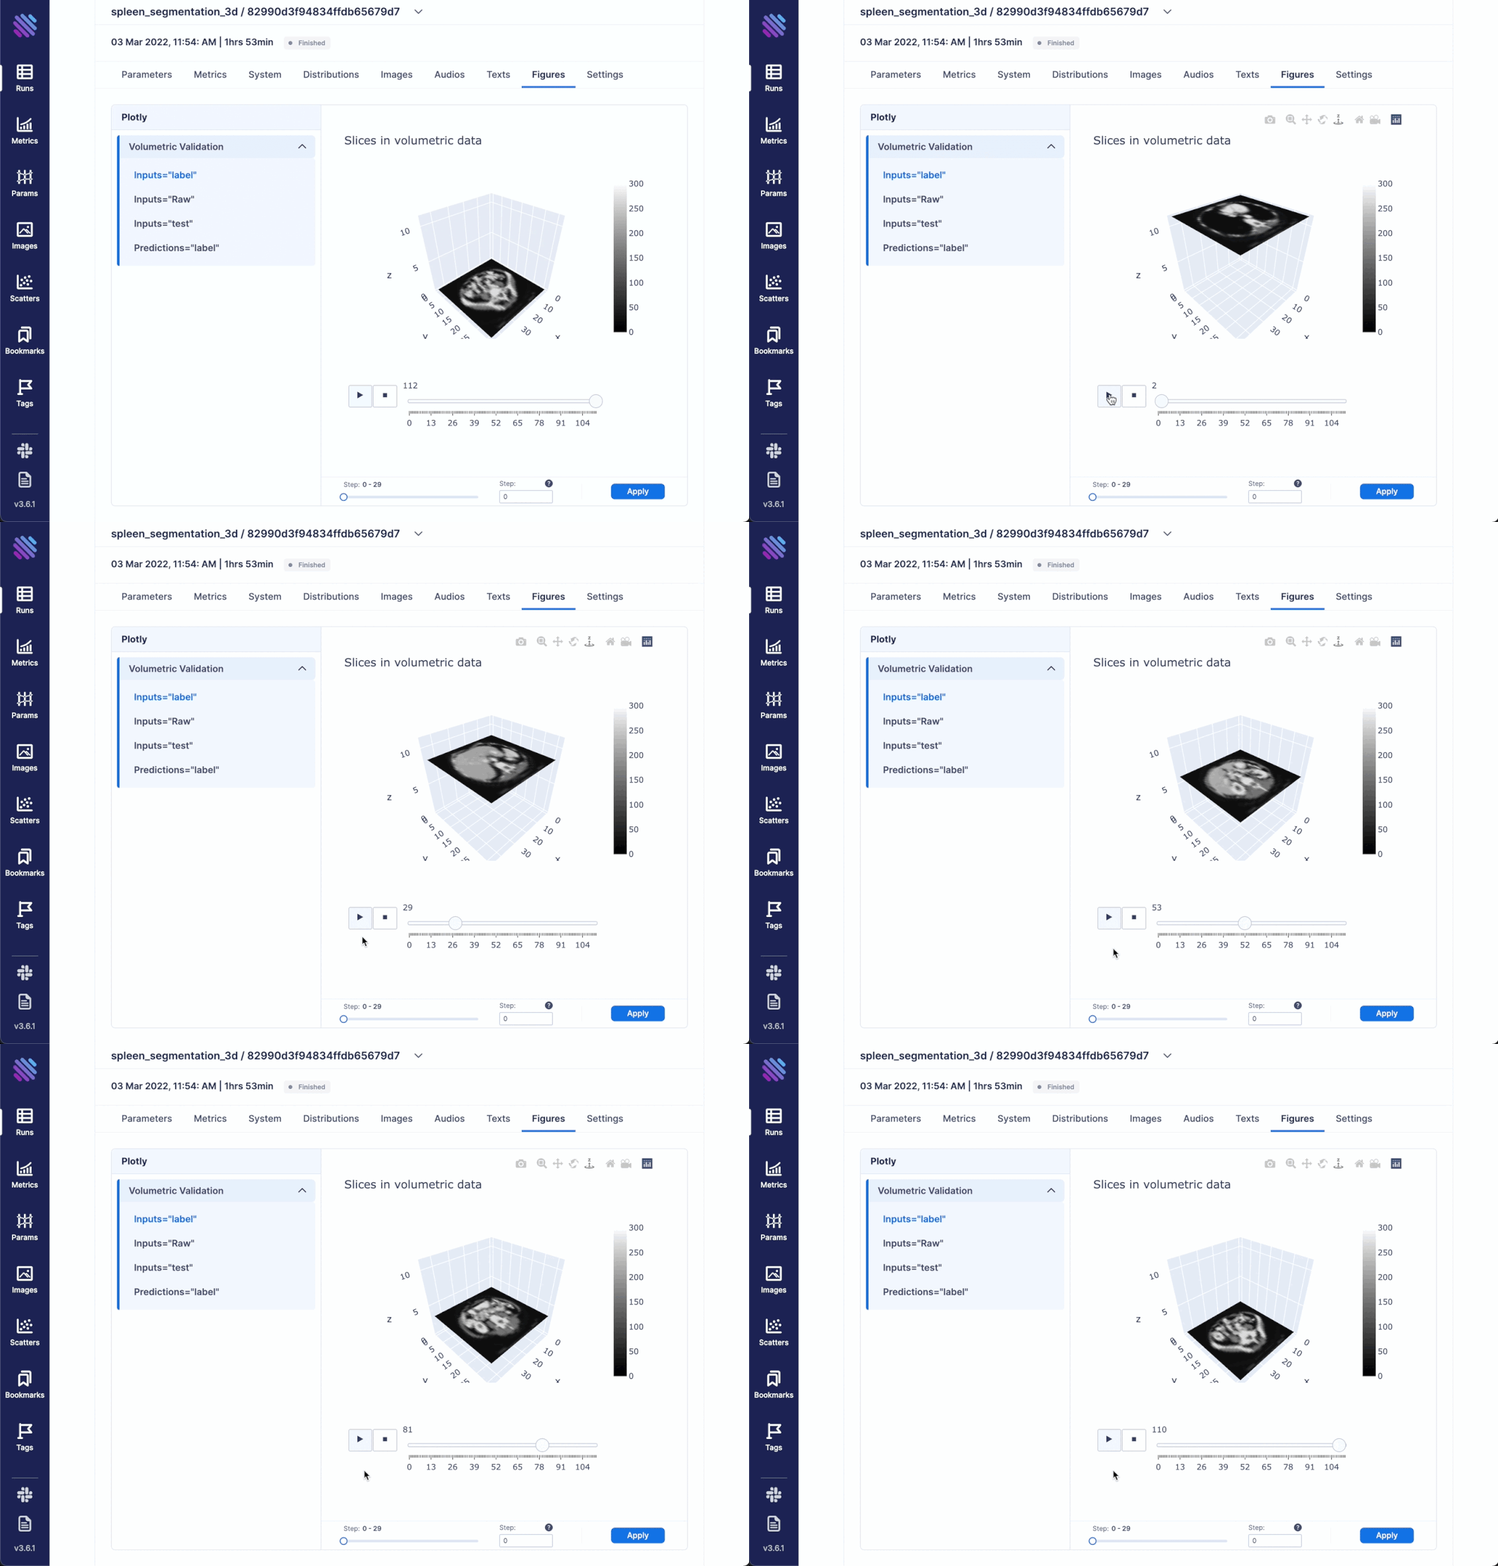
We decided to go beyond simply comparing images and try to incorporate the complete scale of 3D spleen segmentation. For this very purpose created an optimized animation with plotly. It showcases the complete (or sampled) slices from the 3d objects in succession. Thus, integrating any kind of Figure is simple as always
aim_run.track(
    aim.Figure(figure),
    name='some_name',
    context={'context_key':'context_value'}
)
Within Aim you can access all the tracked Figures from within the Single Run Page
``
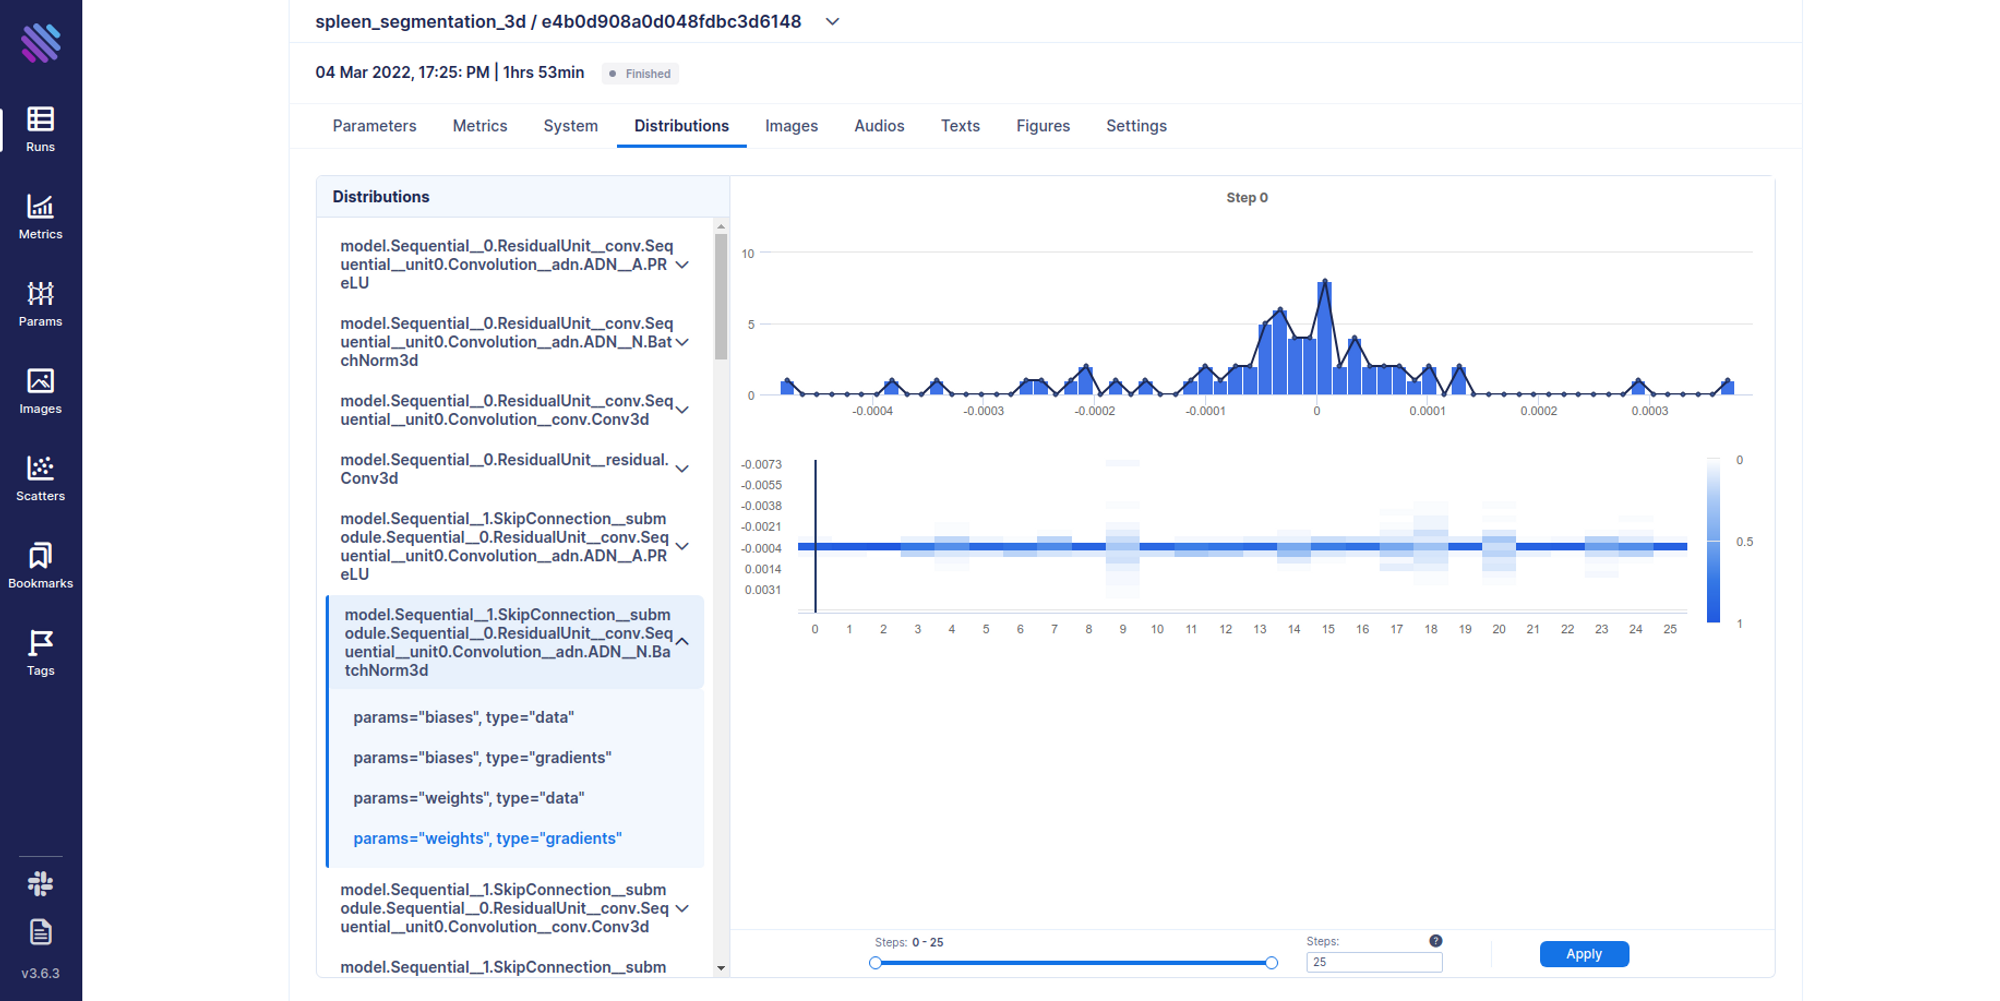
Another interesting thing that one can track is distributions. For example, there are cases where you need a complete hands-on dive into how the weights and gradients flow within your model across training iterations. Aim has integrated support for this.
from aim.pytorch import track_params_dists, track_gradients_dists

....

track_gradients_dists(model, aim_run)
Distributions can be accessed from the Single Run Page as well.
The curtain falls
In this blogpost we saw that it is possible to easily integrate Aim in both ever-day experiment tracking and highly advanced granular research with 1-2 lines of code. You can also play around with the completed MONAI integration results with our interactive demo.
If you have any bug reports please follow up on our github repository. Feel free to join our growing Slack community and ask questions directly to the developers and seasoned users.
If you find Aim useful, please stop by and drop us a star.